by Eli Wright
After two holiday-shortened weeks, marked by new highs for such key indices as the Dow, S&P 500 and NASDAQ we've arrived at the first full trading week of 2017. Volatility may drop as trading volume increases. The VIX is currently at 11.73, down 16.5% since the end of 2016.
In Asia overnight, markets played off Friday's US close, and pushed higher. The Hang Seng closed up 0.3% at 22,570 while the Shanghai Composite rose 0.51%, to 3,170.35. Keep an eye on President-elect Trump's news conference, scheduled for Wednesday, which could have a dampening effect on Asian stocks. His views on China and global trade in general are anticipated and will no doubt be heavily scrutinized.
In Europe this morning, the FTSE is up 0.3% to an all-time high of 7,231.75. However, the DAX and Stoxx 50 are both 0.50% lower, down to 11,539 and 3,301.50, respectively.
On Wall Street this past Friday, the Dow came within one point of 20K in intraday trading, before closing the day at 19,963.80. The S&P 500 and NASDAQ both closed at record highs, of 2,276.98 and 5,521.06, respectively.
Look for all three majors to try and extend gains in trading today. In pre-market trading, the Dow is up 0.04%; the S&P is up 0.06%; and the NASDAQ is up 0.17%.
US Treasurys are down across the board. The 2-year yield is 1.218; the 10-year yield 2.41%; and the 30-year yield is 2.994%.
Forex
Friday’s NFP report was neutral, as the headline figure of 156,000 came in lower than the expected 178,000, and US unemployment ticked higher to 4.7%. On the plus-side, U6 unemployment, which also measures part-time workers and those marginally attached to the labor force, improved to 9.2%. Average wages also increased, up 0.4%.
Providing further room for dollar optimism were hawkish comments by several FOMC members. Cleveland Fed President Loretta Mester said she would like to see the central bank raise interest rates more than the three quarter-percentage-points favored by most of her colleagues, while Richmond Fed President Jeffrey Lacker said interest rates may need to rise “more briskly than markets anticipate.”
The US dollar moved higher after the NFP; the US Dollar Index is currently up to 102.30. The euro is up slightly this morning, to $1.0543, but the dollar has made strides against the British pound and Japanese yen.
A few notes on emerging markets: Following the New Year’s eve terrorist attack in Istanbul that claimed the lives of at least 39 people, Turkey fired 8,000 civil servants this past Saturday for alleged terror links. The lira is now down to 3.6982 against the dollar. Since the failed coup on July 15, USD/TRY has declined more than 26%.
At the same time, the Chinese yuan, which gained sharply versus the dollar last week, has fallen back 0.2% today to 6.953. Chinese CPI is due out this evening.
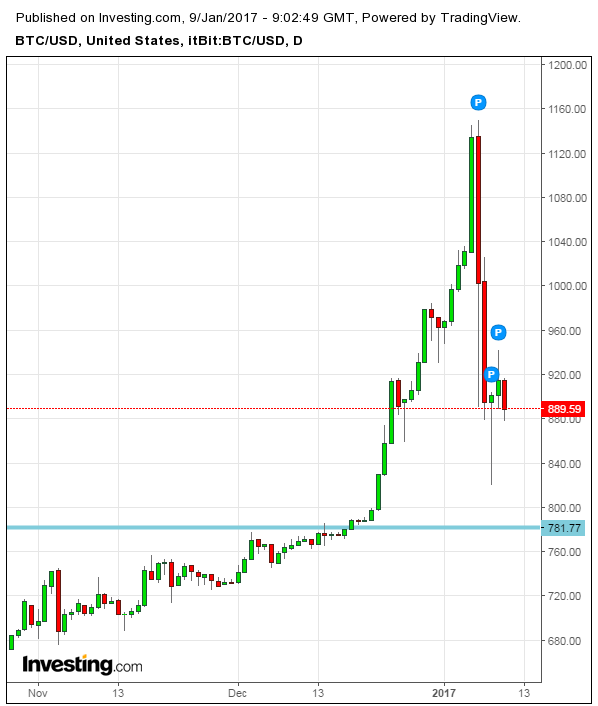
Bitcoin, after massive gains earlier in the week, reversed sharply at the end of last week. It continues to slide today. The crypto-currency is down 2.24% this morning, to $889.59. At this rate, it could be headed toward $800 next.

Commodities
Oil finished Friday higher, posting its fourth consecutive weekly gain, as traders remained optimistic that OPEC members and other global producers will be sticking to their agreement to limit output.
While Baker Hughes reported a 4-rig increase last week, according to the Energy Information Administration, US crude inventories dropped 7.051M, better than the expected 2.152M decrease.
Oil is currently down about 0.4%. As of this writing, crude is trading at $53.59 while Brent is at $56.70.
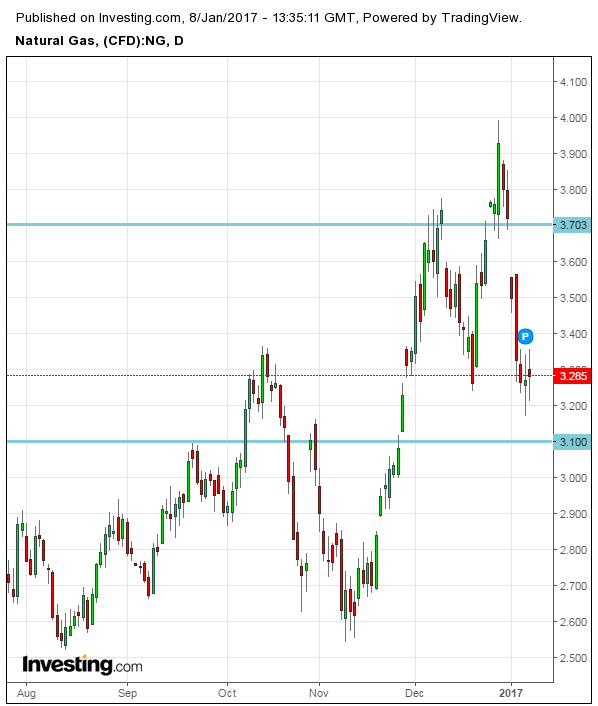
Natural gas prices have been declining since December 28, when weather models started predicting warmer-than-usual temperatures in the US for much of January. Additionally, natural gas inventories declined by 49B last week, far less than the anticipated 82B decline. Prices are currently down to $3.261.
That said, there may be an upward reversal in advance of mid-January, one of the seasonal demand peaks for natural gas. Momentum could drag prices down further, to $3.10. However, there is also upside potential for futures to extend to $3.70.

In precious metals, gold rose 1.97% last week, although it retreated from one-month highs in the final session on Friday. Gold is up 0.23% this morning, to $1,176.15, but despite near-term gains, the outlook for the yellow metal remains bearish, as the stronger dollar and higher interest rates will weigh on prices.
Silver also spent much of last week trading higher, but it fell back 0.69% on Friday. It’s currently trading at 0.01% lower, at $16.517.
Stocks
US stocks kicked off 2017 in high gear: the Dow gained 1% on the week last week; the S&P 500 Index climbed 1.7%; and the NASDAQ gained 2.6%. The Russell 2000 rose 0.8% on the week.
Both the S&P and NASDAQ charts are displaying saw-tooth patterns, alternating weekly advances and declines since mid-November. This could be the week the pattern is broken and gains continue unabated. The Dow is knocking on the door of 20K, just waiting to get past that threshold.
However, traders should be mindful that market giddiness is largely a function of irrational exuberance and not driven by fundamentals. As David Rosenberg, chief economist at Gluskin Sheff and Associates said via the Globe and Mail: “It seems to me that this Trump rally in risk assets has gone too far and too fast.”
Among other warning signs, the recent spate of gains has propelled the S&P 500’s price-to-expected-earnings ratio as of December 31 to 16.9, above five, ten, and 15-year averages. If analysts were not projecting record-level earnings over three of the next four quarters, the forward 12-month P/E ratio would be even higher.
As Andrew Lapthorne, quantitative strategist for Société Générale (PA:SOGN) told the Financial Times:
“The U.S. stock market has only been this expensive during three or four months of the tech bubble.”
Kathleen Brooks, Research Director at City Index UK wonders if the US major indices are running on borrowed time. This morning she noted:
The Dow was so close to 20,000 on Friday and we expect it to breach this level this week. But what then? Declines in the Russell 2000 (US small cap index) and the Dow Jones Transport Index, both typically leading stock market indicators, make us a little nervous that a breach of 20,000 will fail to herald a new, more energised rally for stocks, and instead we could see a pullback if 20,000 is breached.
With inflated faith-based stock valuations, and still-low Treasury yields, some investors are taking a look at junk bonds.
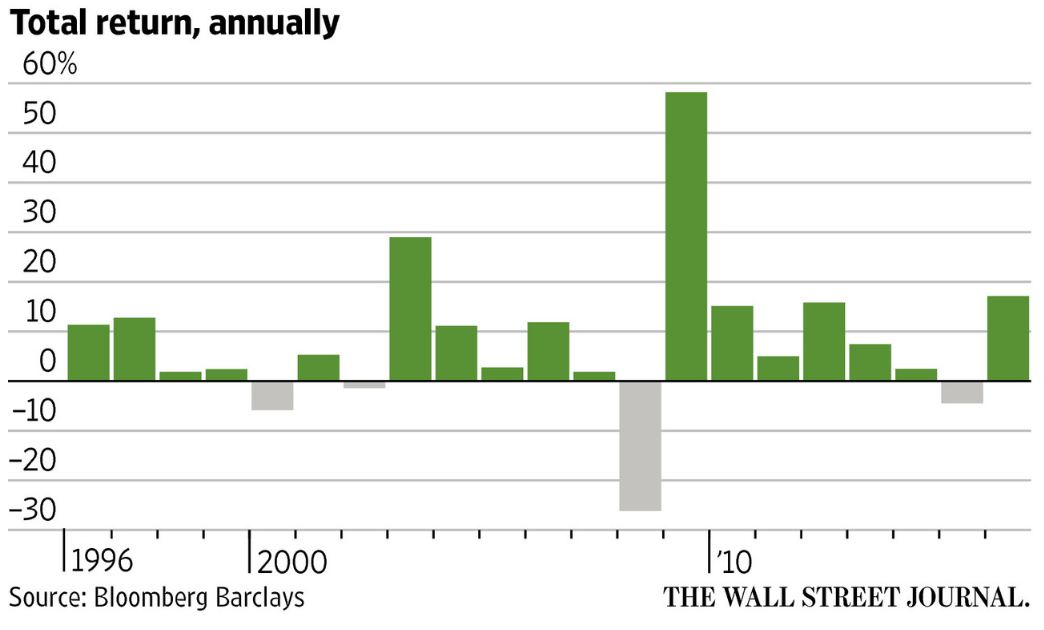
The Bloomberg Barclays U.S. Corporate High Yield Index returned 17.1% in 2016, its best total return since 2009 – and better than all three major US indices.

Over the past ten years, each year of double-digit returns—and there were four of them—was followed by a down year. However, analysts are still optimistic about junk bond potential moving forward.
Two thirds of large banks surveyed by The Wall Street Journal, predict positive returns for junk bonds in 2017. Analysts at JP Morgan expect an 8% return; while the analysis from Wells Fargo projects 5- 6%; Bank of America's figures call for a 4-5% return; Goldman Sachs' analysis is a bit less exuberant, calling for returns of just 3%.
The contrarian view, however cautions that junk bonds have historically defaulted at an average annual rate of 4.2%, meaning much of the additional yield that investors hope to capture over US Treasurys could easily disappear, and the spread might not be enough to justify junk bond positions.
