- Best S&P rally in 15 months
- Best Dow Jones rally in 2 years
- Asia declined, Europe rallies, US futures fall
- VIX reaches 2.5-year high
- Goldman Sachs (NYSE:GS) urges 'buy the dip'
- BTC completes hourly H&S, implying $8,700 target
- US EIA crude inventories will be realeased at 10:30 EST: stockpiles are expected to fall by 480,000 barrels, from a 6.78 million increase a week earlier.
- RBNZ Interest Rate Decision, Monetary Policy Statement, Rate Statement and Gov Spencer Speaks: rates expected to remain unchanged at 1.75 percent.
- Tesla (NASDAQ:TSLA) is scheduled to report earnings for Q4 2017, after the close. Expectations are for an EPS of $-3.75 versus $-1.20 year-over- year. As usual, Tesla’s deliveries, which were disappointing, propel most of its earnings results since vehicle sales represent the automaker’s main revenue stream at the moment.
- UK Interest rate decision tomorrow at 07:00 EST. While almost certainly to remain at 0.5 percent, after first rate hike in a decade, it is expected to rise again in May.
- The Stoxx Europe 600 Index increased 0.4 percent as of 8:23 a.m. London time (5:23 EST), the first advance in more than a week.
- S&P 500 Futures sank 1.1 percent.
- The MSCI Asia Pacific Index increased 0.2 percent, the largest climb in more than a week.
- The U.K.’s FTSE 100 gained 0.6 percent, the first advance in more than a week.
- The MSCI Emerging Markets Index advanced less than 0.05 percent, the first uptick in a week.
- The Dollar Index decreased less than 0.10 percent.
- The euro fell less than 0.05 percent to $1.2372.
- The British pound dipped 0.1 percent to $1.3931, the weakest in almost three weeks.
- The Japanese yen gained 0.6 percent to 108.96 per dollar, the strongest in more than a week.
- South Africa’s rand declined 0.2 percent to 11.9431 per dollar.
- The MSCI Emerging Markets Currency Index rose 0.4 percent.
- The yield on 10-year Treasuries dipped four basis points to 2.76 percent.
- Germany’s 10-year yield climbed one basis point to 0.70 percent.
- Britain’s 10-year yield advanced less than one basis point to 1.523 percent.
- West Texas Intermediate crude climbed 0.4 percent to $63.65 a barrel.
- Gold climbed 0.5 percent to $1,330.74 an ounce.
Key Events
In yesterday's Opening Bell, we noted that after the US market consolidation that began last Friday there might be buying opportunities for US stocks. As previously noted, it was the worst selloff in 6 ½ years.
After yesterday's open, a plunge in the early session added to the anxiety brought on by Monday’s rout. However, traders rode the 'wild roller coaster,' which ultimately took them higher.
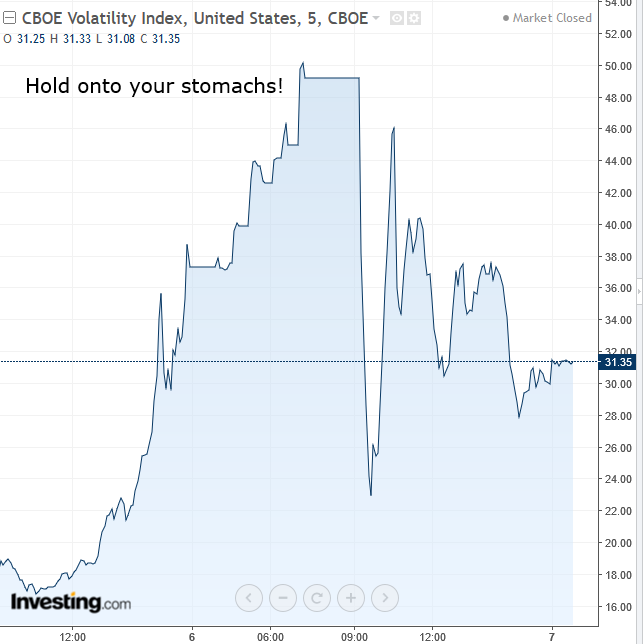
There were at least a dozen whipsaw swings, during which the CBOE Volatility Index, more popularly called the VIX, reached its highest point in 2 ½ years, since August 2015, after China devalued the yuan.
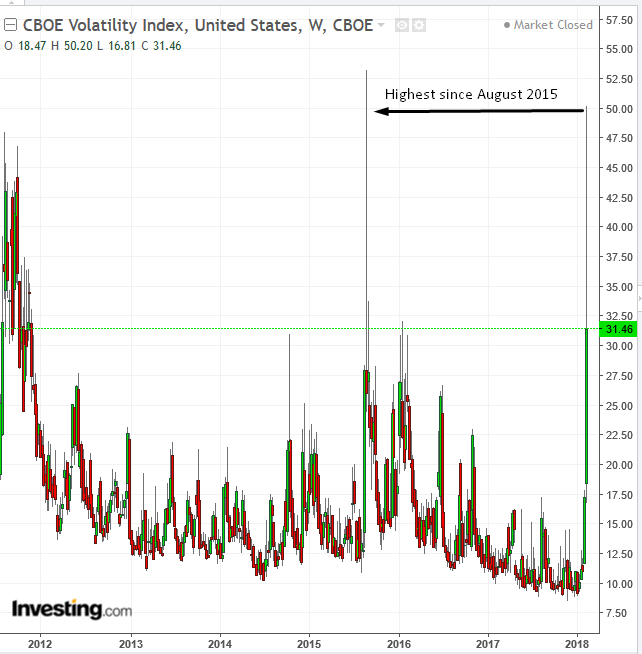
Similar to what happened in 2015, yesterday's VIX swings represented a give-and-take between traders who considered it a buying opportunity and those who feared further declines. And oh boy, what a buying opportunity it turned out to be. US stocks rebounded with a vengeance, posting their biggest rally in 15 months.
Global Financial Affairs
The S&P 500 climbed 1.74 percent yesterday, led by the Materials sector which rose 3.22 percent, followed closely by Technology which saw a 2.82 advance and Consumer Discretionary which gained 2.56 percent—growth sectors all. Only two sectors were in the red, Utilities, a defensive sector, lost 1.51 percent, while growth sector Real Estate retreated a mere 0.2 percent.
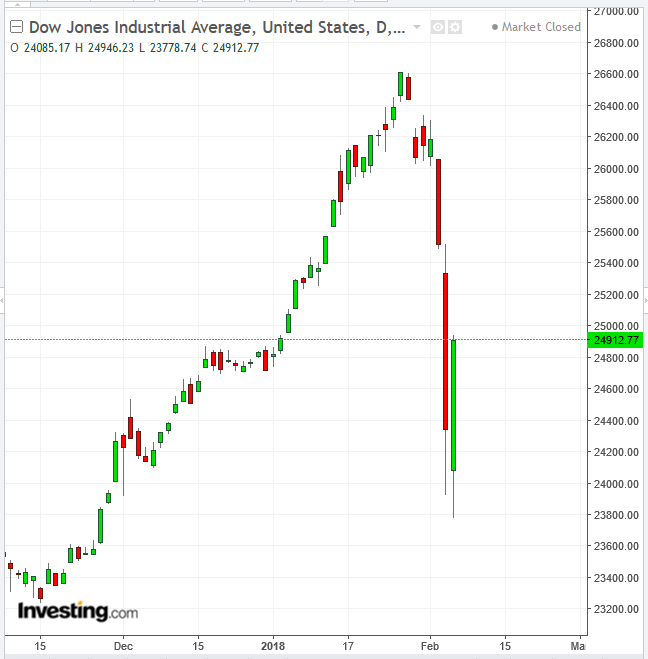
The Dow Jones Industrial Average did even better, bouncing 2.35 percent, led by shares of DowDuPont (NYSE:DWDP) and Home Depot (NYSE:HD), for a 567-point surge, the biggest gain for the index in two years. The NASDAQ Composite climbed 2.15 percent while the Russell 2000 climbed 1.00 percent.
This morning however, Asian markets weren't seeing the buying opportunity. They fell along with US equity futures.
Japan’s TOPIX eked out a 0.4 percent gain, while the Nikkei 225 crawled higher by 0.2 percent. China’s Shanghai Composite dropped 0.8 percent; shares listed on Hong Kong’s Hang Seng dropped 0.9 percent.
Asia’s inability to recover today suggests investors are yet to be convinced the selloff is finished. That's understandable considering the VIX, often referred to as the 'fear gauge,' ranged 121.5 percent—between its low of 22.50 and a high of 50.00.
The Stoxx Europe 600 in tandem with US futures, may today be confusing analysts. After the dismal Asian session, the European index has started its first rise in eight days, with most sectors participating. But US futures retreated, making it next to impossible to 'read' the markets.
Still, the supposed reason for the equity plunge, a selloff in Treasuries, eased.
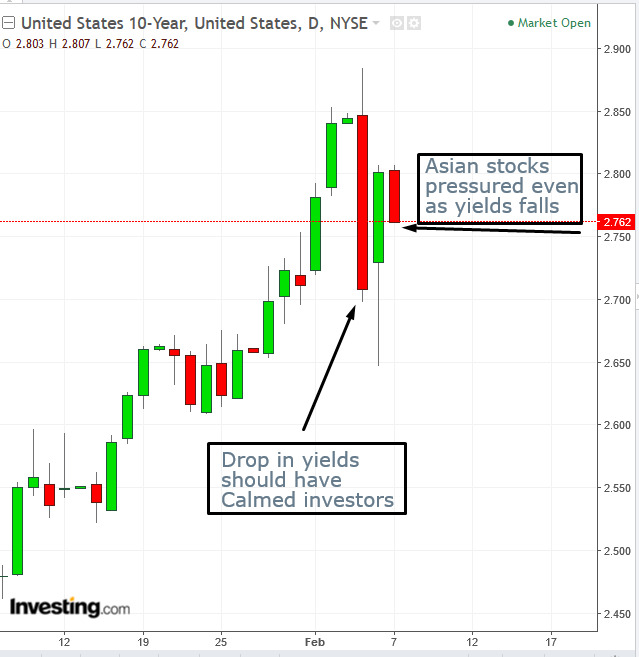
The 10-year Treasury yield dropped four basis points to 2.18 percent, erasing 4 ½ days of gains, which not so coincidentally were the same days that riled markets. That reinforces our observation yesterday that the decline in equities has all the telltale signs of herd mentality rather than fundamental triggers.
The fact that investor nerves are still frayed suggests that it may be emotions more than analysis which drove Asian losses this morning. Clearly, when emotions run high—whether they're correct or not—risk inevitably becomes elevated.
To be fair, investors are also concerned the Fed's tightening cycle will pull out all the cheap money from markets, as historically low borrowing costs disappear. Moreover, the historically low stock market volatility attracted considerable capital, which normally would go to bonds. However, the low rates provided no meaningful yield, thereby tempting yield investors into stocks.
Yesterday’s extreme volatility thus vindicates bears, who have been fearing the storm after the prolonged quiet. Of course, this will likely scare all those investors who were attracted by the low volatility.
Still, yesterday's rebound did bring out the dip buyers and included a call by Goldman Sachs' chief strategist who said the reversal was only a technical correction rather than fundamentally driven.
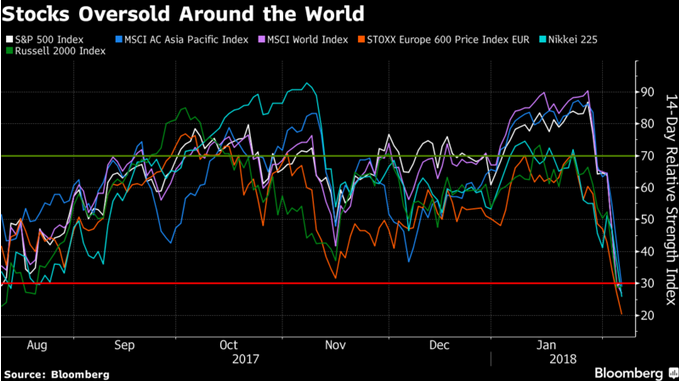
Even if traders are still undecided regarding whether yesterday's rally is sustainable over the longer term, global markets have definitely reached oversold levels.
Oil rose after a three-day slide after the API weekly report showed an unexpected decline in US crude stockpiles.
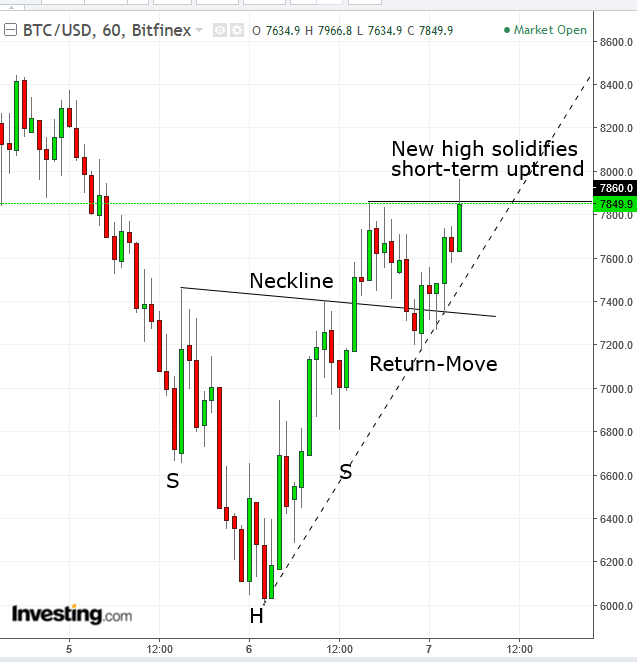
Bitcoin rebounded from yesterday’s $6,000 low, though it's still trading under $8,000. A completed H&S on the hourly chart implies a target of $8,700
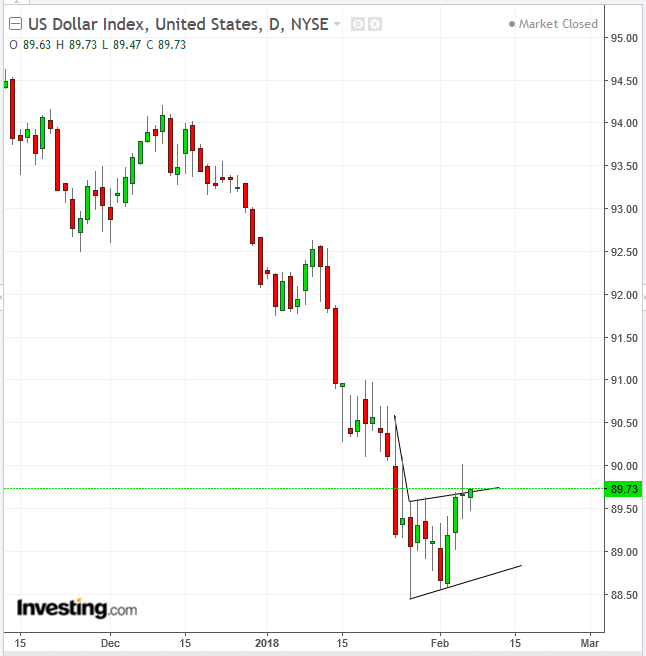
The dollar continues to trade within a bearish rising flag.
Up Ahead
Market Moves
Stocks
Currencies
Bonds
Commodities
