- S&P 500 sinks 4.2 percent; all sectors deep in the red
- Dow falls 4.5% or more than 1,100 points
- Wells Fargo weighs on sector, falling 5%
- Stoxx Europe 600 Index falls hardest since June 2016
- Dollar ends 2-day advance, resumes bearish flag pattern
- Oil sold off a third day on weakening price action
- Bitcoin hits $6,000 slipping below falling channel
Key Events
Yesterday, US equity investors watched stocks fall hard as the worst market rout in six-and-a-half years played out on concerns that rising inflation will hasten higher interest rates.
The S&P 500 Index sank 4.1 percent, its worst performance since the US lost its pristine credit rating in 2011. All sectors were deep in the red, led by Financials which experienced a staggering 5.04 percent drop. Utilities dropped the least, losing just 1.64 percent.
Global Financial Affairs
The market's worst selloff in years was fueled by rising yields and the outlook for a faster pace on rate hikes. As such, it would make sense that financials, which have the most to gain from higher interest rates, should outperform, not underperform.
However, yesterday's financial sector selloff was triggered by shares of Wells Fargo (NYSE:WFC) tumbling more than 9% in reaction to an enforcement action by the Fed in response to "widespread consumer abuses" which involved bank employees opening millions of fake accounts using actual customer names and information without customer authorization. The action restricts the bank from increasing its total assets as of the end of 2017 until "sufficient improvements" are made.
Fueling the declines: at least five Wall Street investment banks downgraded WFC shares after news of the Fed's disciplinary action broke.
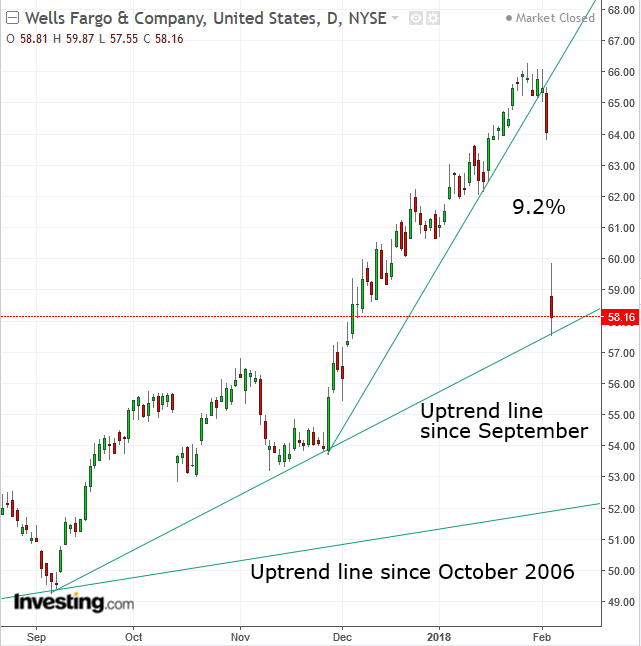
Wells Fargo's price per share fell 10.15 percent on an intraday basis, but losses were pared back to 9.2 percent. The rebound bounced off the uptrend line since September, demonstrating there were still some traders who were bullish the stock.
In a contrarian stance, Bank of America Merrill Lynch (NYSE:BAC) considers the selloff—and indeed the downgrades—an overreaction, with one of the bank's analysts saying “We would view any potential weakness in the shares as particularly attractive buying opportunity."
Indeed, the same could be said about the S&P 500.
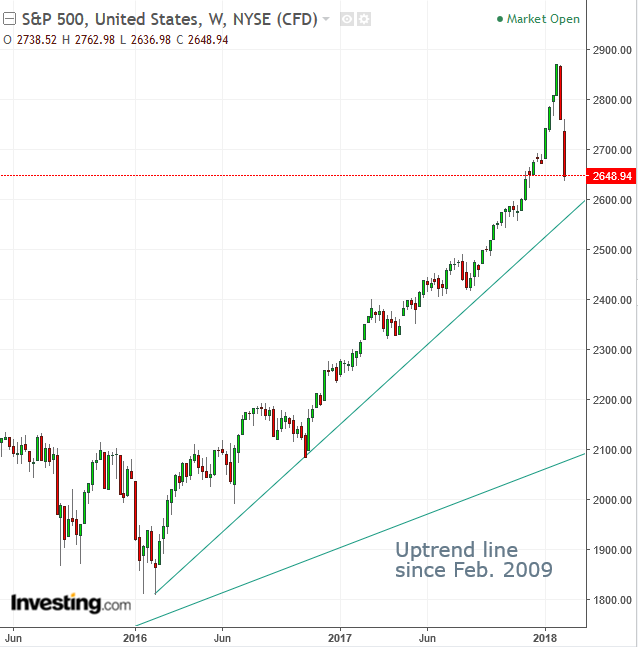
The SPX selloff, now running into its second week, saw the benchmark correct by 7.5 percent, wiping out all gains since the beginning of December. This should be considered a healthy correction. As well, the price has returned to the vicinity of its uptrend line since February 2016, for the first time since August 2017.
If the price remains above this uptrend line, or the 2,500-price level, this should be viewed as a buying opportunity. However, should that level fail to provide support, the price may fall to its primary uptrend line since February 2009 at the 2,200 level.
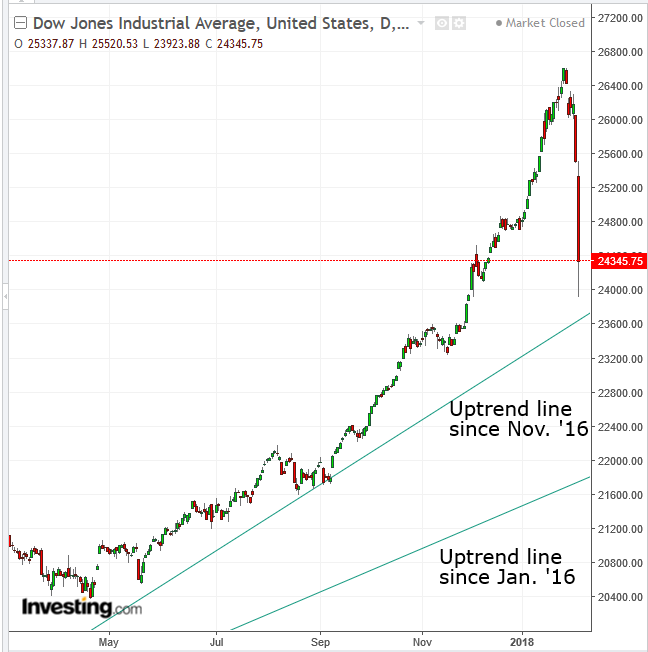
The Dow Jones Industrial Average was hit even harder yesterday. The mega cap index lost more than 1,100 points, or 4.57 percent of its value. It was the worst fall for the Dow since August 2011.
The price appeared to have found demand above the uptrend line since November 2016, when the Trump Trade began, as it bounced back within 15 minutes after a more-than-800-point drop around 15:00 EST. As opposed to the S&P 500, the Dow has an additional uptrend line where support could be found, before the primary line since 2009, which began in January 2016.
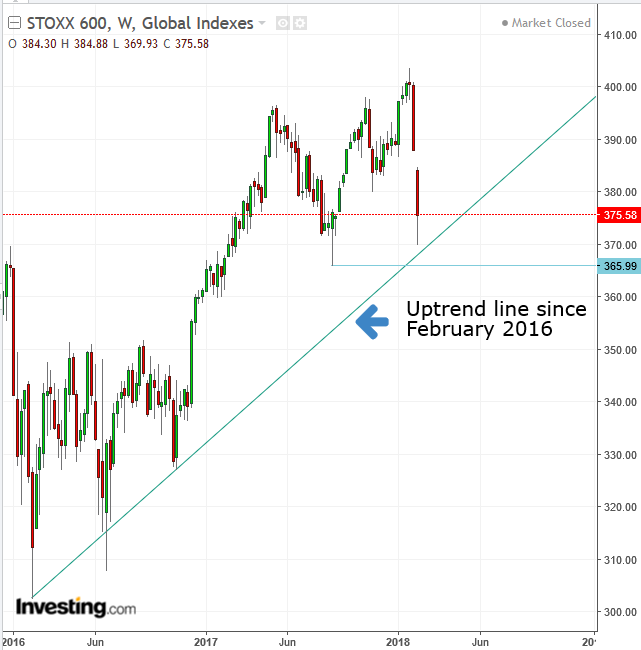
This morning, the STOXX Europe 600 Index fell the hardest since the Brexit surprise in June 2016. As with US indices, all industry sectors were in the red, losing at least 2 percent of value.
This on the heels Japan’s Nikkei 225, which entered a correction too, leading the MSCI Asia Pacific Index lower.
The current global selloff has the makings of an overreaction. Its very cause, the Treasury selloff, has more than eased.
The US 10-year Treasury yield dropped four basis points to 2.81 percent, or 4.7 percent, wiping out almost 5 days of gains. This should have been tantamount to eradicating the reason for the equity rally. But it didn’t.
At this point, it’s a snowball effect. The question is whether investors will remain cold to equities, thereby increasing the size of the snowball, or will they warm up to the relatively more attractive prices now in play.
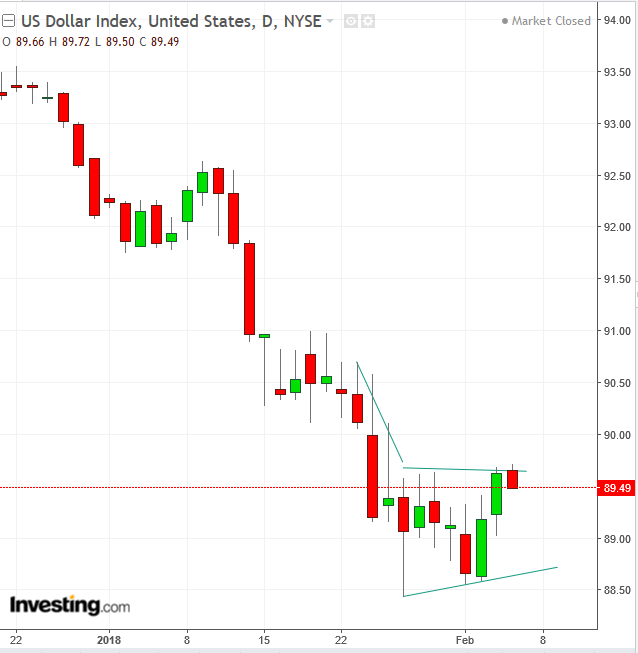
The dollar index is falling, ending a two-day advance. Nevertheless, the global reserve currency continues to trade within the flag pattern. A downside breakout would signal a resumption of the prior downtrend.
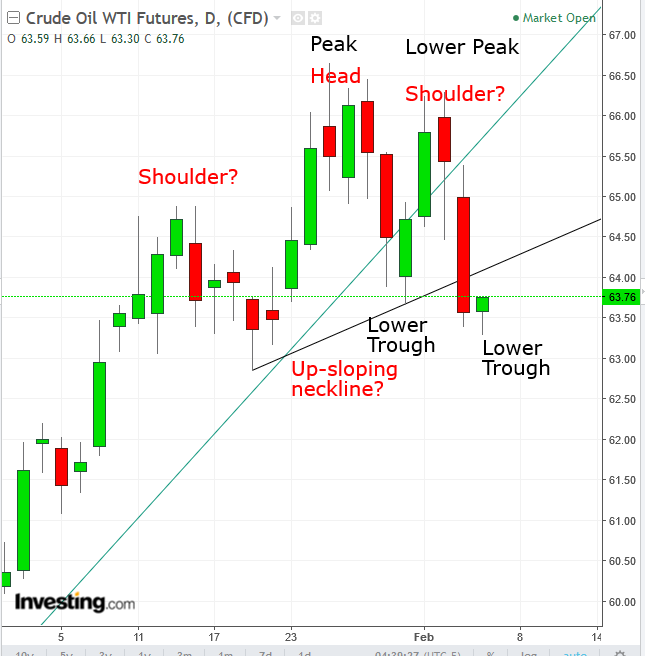
Oil sold off for a third day, pulling metals down with it, after US explorers raised the number of rigs drilling for crude by 6 to 765, the most since August, according to Baker Hughes.
Technically, the price fell below its uptrend line since December 14 and below its uptrend line since January 19. It is also showing a reshifting of the supply-demand balance as peaks and troughs are edging lower. Some aggressive traders might argue that a H&S top has been formed. Other than its lack of symmetry, it is also very small, while a more reliable one should span shoulder-to-shoulder at least for 3 months. This one lasted less than a month.
Copper climbed the most in a week.
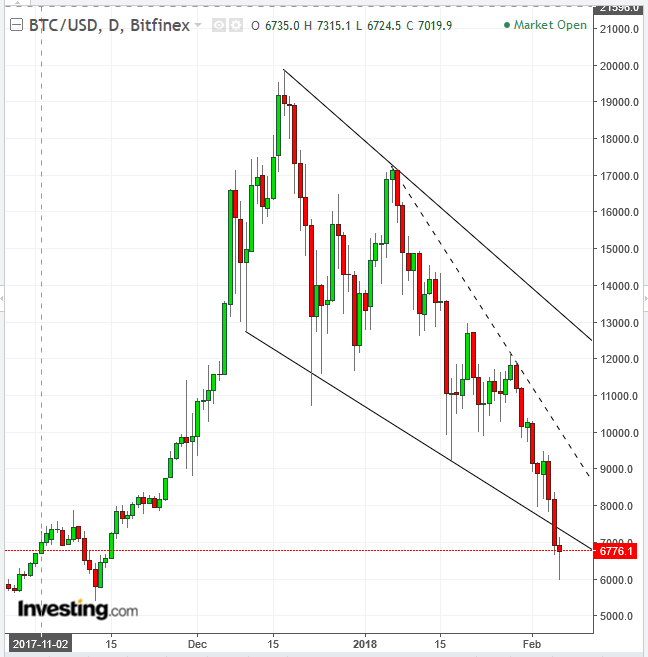
Bitcoin fell below its falling channel since December, signaling the increased probability of a steeper decline. It may be forming a bullish hammer today after reaching our second, long-term $6,000 target, to the penny. It should be noted that a hammer merely visually demonstrates a bullish pushback. That doesn’t always mean that bears can’t push back harder. Case in point: Friday’s hammer was invalidated after the price kept falling.
Up Ahead
- General Motors (NYSE:GM) reports Q4 2017 earnings today before the market opens. Expectations are for an EPS forecast of $1.34 versus $1.28 for the same quarter last year.
- Walt Disney Company (NYSE:DIS) is expected to report earnings after market close today, with an EPS consensus of $1.62 versus $1.55 YoY
- Dallas Fed President Robert Kaplan and New York Fed President William Dudley are among policy officials due to speak in Frankfurt and New York
Market Moves
Stocks
- The Stoxx Europe 600 Index decreased 2.2 percent as of 8:25 London time (3.25 EST), hitting the lowest in more than five months with its seventh consecutive decline and the largest dip in more than 19 months.
- S&P 500 Futures rose 0.8 percent, the biggest advance in more than a week.
- The MSCI Asia Pacific Index sank 3.5 percent on the largest tumble in more than 19 months.
- The U.K.’s FTSE 100 dipped 2.2 percent, reaching the lowest in almost 10 months on its sixth consecutive decline and the biggest decrease in almost 10 months.
- The MSCI Emerging Markets Index sank 3 percent to the lowest in five weeks on the largest tumble in more than 19 months.
Currencies
- The Dollar Index fell 0.1 percent.
- The euro rose 0.5 percent to $1.2424.
- The British pound gained 0.1 percent to $1.3976.
- The Japanese yen dipped 0.1 percent to 109.20 per dollar.
- South Africa’s rand jumped 0.4 percent to 12.0765 per dollar.
- The MSCI Emerging Markets Currency Index fell 0.1 percent.
Bonds
- The yield on 10-year Treasuries increased six basis points to 2.76 percent.
- Germany’s 10-year yield decreased three basis points to 0.71 percent.
- Britain’s 10-year yield declined three basis points to 1.53 percent, the biggest drop in almost five weeks.
Commodities
- West Texas Intermediate crude decreased 0.6 percent to $63.78 a barrel, the lowest in more than two weeks.
- Gold rose 0.1 percent to $1,341.34 an ounce.
