- Global stocks under pressure as German, South Korean data rekindle global slowdown fears
- Oil erases half of yesterday’s losses
- Yen rebounds after dropping on BoJ statement
- Dollar nears one-year high
- Sweden’s Riksbank and Bank of Indonesia set monetary policy on Thursday.
- Japan’s Prime Minister Shinzo Abe meets leaders from the European Union on Thursday before flying to the U.S. for a summit with President Donald Trump.
- The initial print of first-quarter U.S. GDP will be closely watched on Friday for clues as to how the economy responded to the government shutdown and to the fourth-quarter market rout.
- Amazon (NASDAQ:AMZN) is due to report earnings after market close on Thursday, with a $4.61 EPS forecast, from $3.27 last year.
- Intel (NASDAQ:INTC) also reports after market close today, with revenue expectations of $16.03 billion and EPS seen at $0.87. The Q1 report from the chip-maker heavyweight will be scrutinized for cues as to whether its stock's strong rally this year is justified.
- European bank earnings kick into full gear with reports from Deutsche Bank (DE:DBKGn) (DE:DBKGn), UBS (SIX:UBSG), Barclays (LON:BARC) and Swedbank (ST:SWEDa).
- The MSCI Asia Pacific Index fell 0.1%.
- TOPIX rose 0.5%.
- The euro was flat at $1.1159.
- The yen rose 0.2% to 111.92 per dollar.
- The MSCI Emerging Markets Currency Index slid 0.3%.
- West Texas crude rose 0.1% to $65.94 a barrel.
- Gold was little changed at $1,276.07 an ounce.
Key Events
European shares hovered below neutral levels this morning and futures on the S&P 500, Dow and NASDAQ 100 struggled to shrug off a mixed Asian session that was weighed down by resurfacing worries on the global economy.
German and South Korean consumer confidence data re-ignited fears around a staggering growth, sending shares lower across China’s Shanghai Composite (-2.43%), Hong Kong’s Hang Seng (-0.86%) and South Korea’s KOSPI (-0.48%). On the other side of the spectrum, Australia’s S&P/ASX 200 (+0.99%) and Japan’s Nikkei 225 (+0.48%) sealed some upbeat gains.
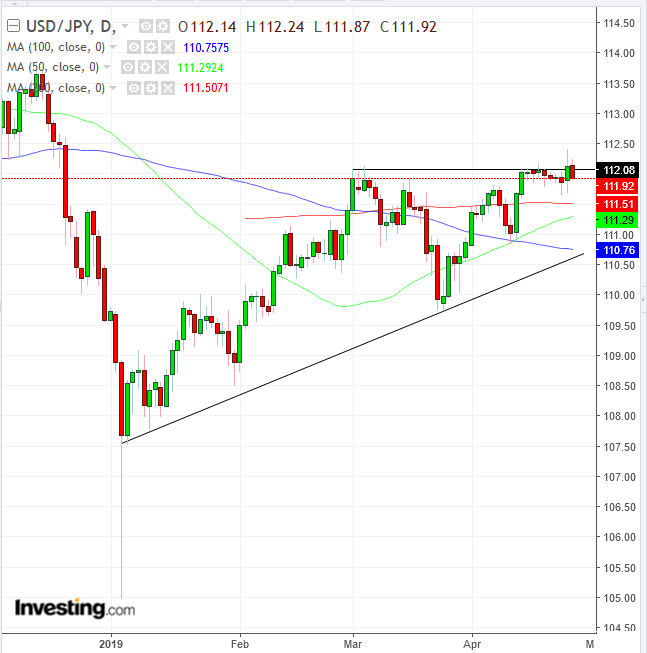
Meanwhile, the yen regained some ground after dropping as the Bank of Japan kept policy unchanged, pledging to hold interest rates at very low levels until at least early next year. Technically, the USD/JPY pair has been unable to cross over the 112 level to keep the uptrend.
Global Financial Affairs
Yesterday, U.S. stocks backtracked from Tuesday's gains as investors tried to assess where the market would go after hitting new records, amid some positive earnings reports and ahead of durable goods orders data, coming out later today, and key GDP figures, due on Friday.
Despite the fact that, so far, 80% of S&P 500 companies beat earnings estimates and shares on both the SPX and the NASDAQ Composite posted record closing prices on Tuesday, stocks have yet to reach new all-time highs—which may have prompted investors to fear being caught on the wrong side of the latest rally.
Both the SPX and the Dow Jones Industrial Average dropped 0.22% and the NASDAQ followed close behind with a 0.23% slide.
AT&T (NYSE:T) and Caterpillar (NYSE:CAT) slid after reporting first-quarter results, while Boeing (NYSE:BA) advanced even as the aviation giant reported a $1bn hit to its bottom line from the recent 737 MAX disaster, suspending forward guidance due to the heightened levels of uncertainty.
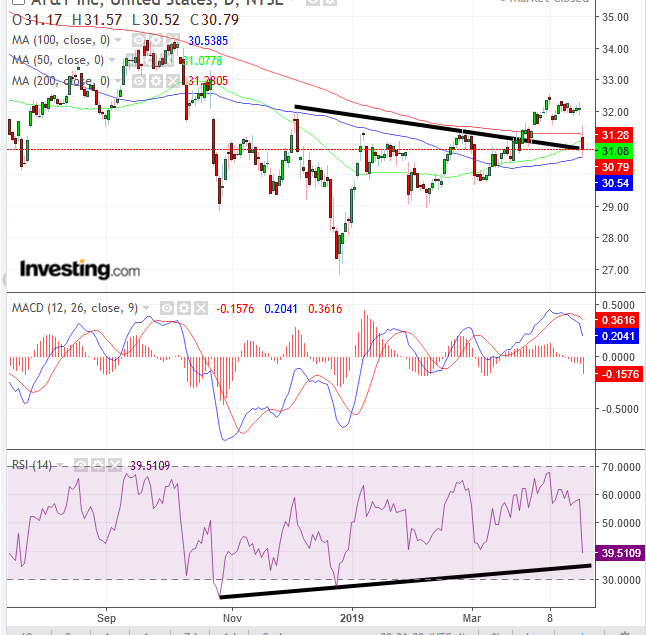
On one hand, AT&T found support at the neckline of a H&S bottom since October, guarded by the 50 and 100 DMA. On the other, it found resistance by the 200 DMA, and the MACD provided a sell signal, while the RIS retained its uptrend—for now.
Meanwhile, Energy stocks—the same that propelled the market to fresh record closes—accounted for most of yesterday's losses, slipping 1.75% lower on the S&P 500. Here, they fell almost three times as much as the second-worst performing sector, Materials (-0.62%). On the Dow, Chevron (NYSE:CVX) (-3.07%) tumbled and Exxon Mobile (NYSE:XOM) was among the worst performing components, giving up 1.94%.
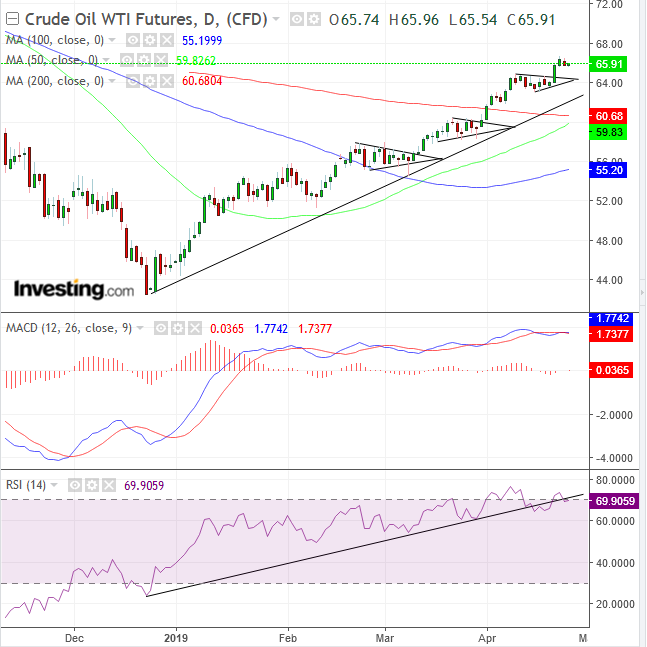
Oil prices, however, found their footing this morning and pared half of yesterday’s losses, when a surprise build in U.S. inventories revealed broader global supply than expected. Technically, the WTI price may be subject to profit-taking after a 55% surge since the December bottom. This dynamic may be emphasized by the fact that both the MACD and the RSI are overbought, and after three continuation patterns—called pennants. However, the completion of the third pennant suggests a continuation of the rally toward $68, perhaps after a return-move as the 50 DMA eyes the 200 DMA to trigger a golden cross. Meanwhile, analysts are questioning the longevity of this week's rally, which was spurred by the re-instatement, from the White House, of sanctions against Iran.
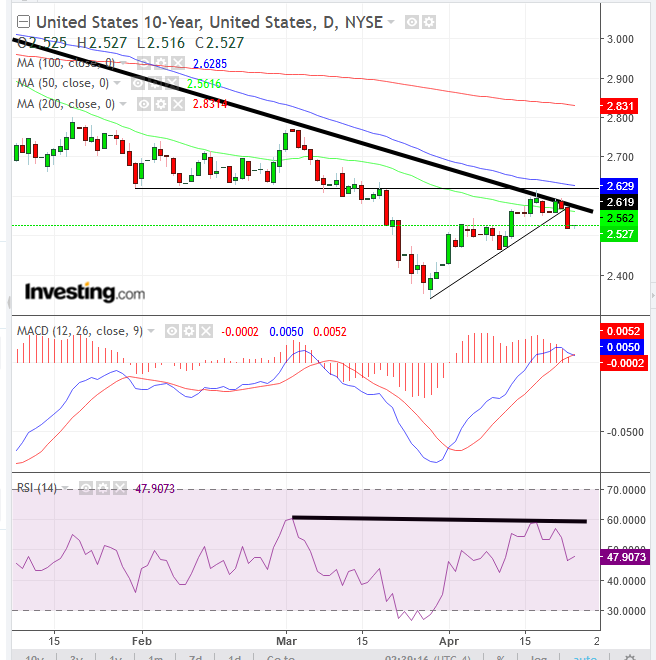
Yields on 10-year Treasurys fell the most since March after finding resistance by the bottom of the previous range, the downtrend line since November and the 50 & 100 DMAs—though they were seen climbing during the European morning session. The RSI and MACD confirmed resistance. The slide below the short-term uptrend line since late-March suggests an end to the recent rally.
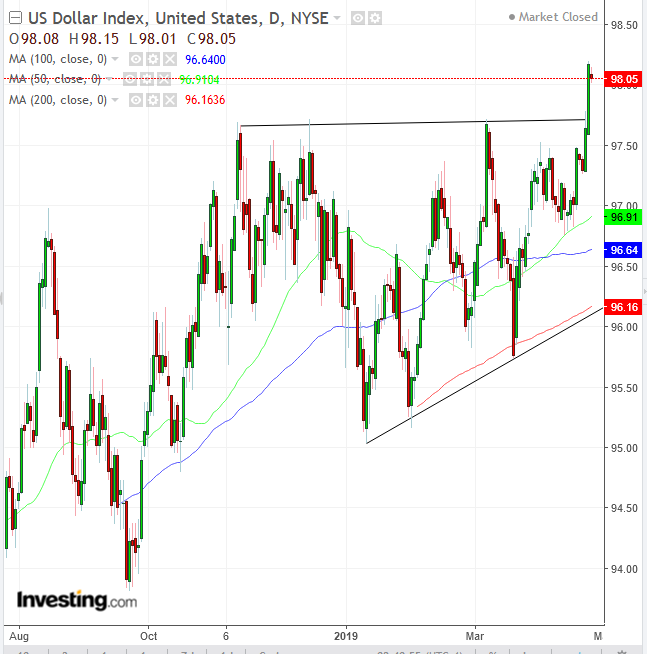
Boosted by a newfound demand for U.S. bonds, the dollar surged to a eleven-month high on Wednesday, breaking through the top of an ascending channel, as eager buyers were willing to raise bids to find sellers. Today, however, the greenback gave up some of that rally.
Up Ahead
Earnings
Market Moves
Stocks
Currencies
Commodities
