- U.S. futures, European shares slip on downbeat U.S., Chinese data
- 10-year Treasury yields resume their slide, posting further signs of caution
- New Zealand join dovish central banks; ECB's Draghi downbeat on economy
- The U.K. Parliament is set to hold several votes on alternative plans to Prime Minister Theresa May’s Brexit package on Wednesday.
-
- U.S.-China trade talks resume on Thursday, with a cabinet-level American delegation due to travel to Beijing.
- Fed official Randal Quarles will speak on Friday to the Shadow Open Market Committee on “Strategic Approaches to the Fed’s Balance Sheet and Communications.”
- Germany’s DAX rose 0.1%.
- The MSCI Asia Pacific Index fell 0.2 %.
- The MSCI Emerging Market Index climbed less than 0.05 %.
- The Dollar Index was flat.
- The euro was unchanged at $1.1266.
- The British pound slipped 0.1% to $1.3195.
- The New Zealand dollar declined 1.5% on the largest drop in seven weeks.
- The Australian dollar fell 0.5%, the biggest fall in three weeks.
- The yield on 10-year Treasuries dropped three basis points to 2.39 %.
- Japan’s 10-year yield fell less than one basis point to -0.067 %.
- Germany’s 10-year yield fell three basis points to -0.04 %.
- New Zealand’s 10-year yield ticked 11 basis points lower, in the biggest drop in more than two years.
- Australia’s 10-year yield fell five basis points.
Key Events
European shares slid after opening higher and futures on the S&P 500, Dow and NASDAQ 100 hovered in red territory this morning, as a plethora of data misses continued to roil investor sentiment.
The STOXX 600 fluctuated around yesterday’s closing price, initially climbing with automakers and miners shares. The early attempt to shrug off disheartening economic figures from the U.S. and China gave way to worries around global central banks' accommodative turn, with ECB President Mario Draghi signaling economic caution in a speech on Tuesday. The upcoming round of high-level U.S-.China trade talks, taking place in Beijing on Thursday and Friday, also kept markets under pressure.
Yesterday, U.S. housing starts fell from 1.273 million to 1.162 million, missing the 1.213 million estimate, while building permits dropped to -1.5%, down from +1.4%, also missing the -1.3% expectation. Consumer confidence also slipped in March, to 124.1 from 131.4 in February, according to data from the U.S. Conference Board.
The pattern of weak data continued with China’s industrial firms, which posted their worst drop in profits for the months of January and February since 2011, plunging 14%. This follows the Chinese government's reduced economic growth target for the year, to 6.0-6.5%, from 6.6% growth in 2018.

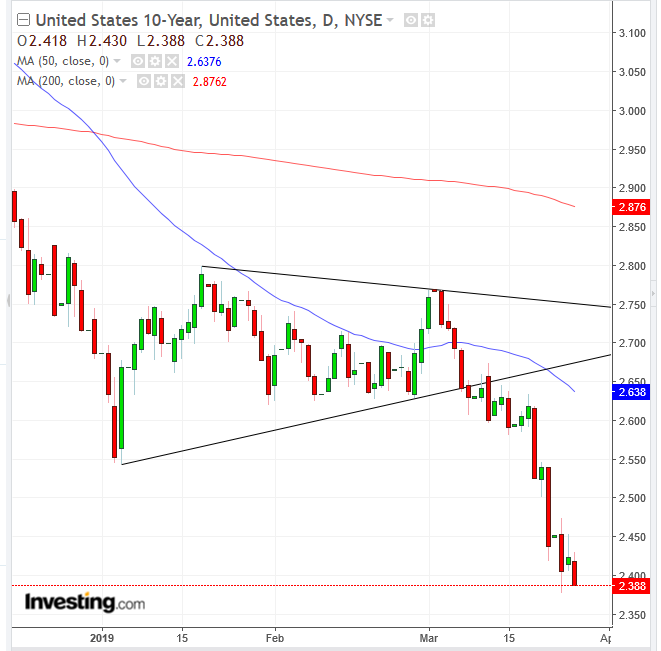
Meanwhile, the yield rebound seen on 10-year Treasurys yesterday was short-lived, as per our forecast. Posting further signs of market prudence, yields resumed their slide today, to 2.388 as of the time of writing—hitting their lowest level since mid-December 2017.
In the earlier Asian session, equities were mixed. Japan’s Nikkei 225 (-0.23%) pared yesterday’s advance, dragged down by carmaker Nissan (-3.5%), amid ongoing fund misuse questions and merger talks with Renault (PA:RENA).
China’s Shanghai Composite (+0.85%) stabilized after a two-day selloff. Hong Kong’s Hang Seng (+0.76%) edged higher for a second day thanks to dip-buying in the final hour, following a four-day drop.
South Korea’s KOSPI (-0.15%) fell for the second day after behemoth Samsung Electronics (KS:005930) (+0.22%) said it would miss expectations on its first-quarter earnings.
Australia’s S&P/ASX 200 (+0.09%) also firmed up, climbing for the second session, as it rebounded from an early selloff, only to find support above the 50 DMA, after last week’s golden cross.
Global Financial Affairs
In yesterday's U.S. session, stocks pared the decline that had been triggered by the Fed's renewed pessimism over growth—which in turn prompted the first real yield curve inversion since the one that signaled the 2008 crash and the following recession. The rebound in equities coincided with an apparent stabilization of 10-year yields, as Bank of America helped ease some market concerns by switching its advisory from defensive to cyclical, citing the Fed’s policy shift and signs of stabilization in the global economy.

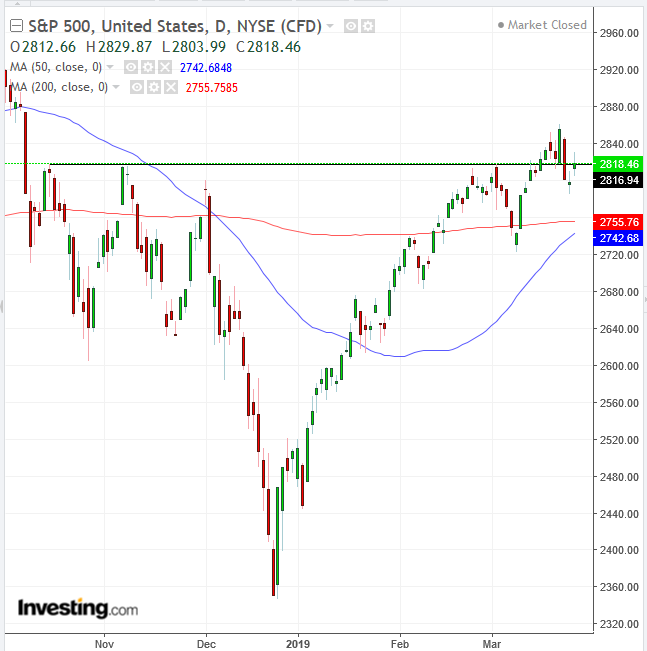
The S&P 500 gained 0.72%, with all eleven sectors in the green. Energy (+1.44%) and Financials (+1.19%) led the rally—the former tracking oil prices higher after Russia reiterated its pledge to cuts, the latter supported by the yields paring some losses. Oddly, Consumer Discretionary (+0.43%), a growth sector, lagged. Technically, the SPX closed less than 0.1% above the resistance formed by the October peak, demonstrating lingering supply at these levels.
The NASDAQ Composite gained 0.71%—coming just 0.01% behind the SPX. Technically, the tech heavy-benchmark closed 0.3% above its October peak.
The Russell 2000 inched 0.64% higher.
The Dow Jones Industrial Average advanced 0.55%, underperforming among U.S. majors. Technically, the price resumed an advance to its second day, after finding support above the 50 DMA. The current rebound helped develop a symmetrical triangle, presumed to be bullish in the uptrend since the December bottom, complete with an upside breakout above 260.00.
In FX markets, the dollar was almost flat, after giving up an advance to 97.00. The pound bounced back from an earlier decline, to end flat for the third day in a row.
The New Zealand dollar slid more than 1% after the country's central bank joined the global shift away from higher interest rates. The Aussie also retreated.

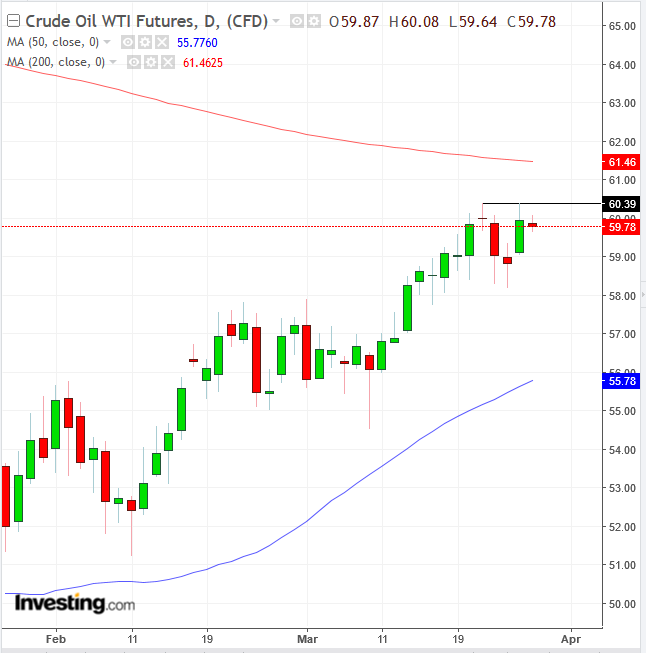
Oil prices slipped after enjoying a temporary rally triggered by Russia's commitment to its production cut targets—in line with Saudi Arabia's tenacious lower supply strategy. Perhaps the resumed decline of Treasury yields scared off investments into the growth-sensitive asset. Technically, the price is unable to cross over the March 21, $60.39 peak.
Up Ahead
Market Moves
Stocks
Currencies
Bonds
Commodities
