- US futures resume US equity rally
- Treasury yields test technical resistance
- Dollar finds support on neckline, but fundamentals and technicals point lower
- Oil climbs for a seventh session but loses steam
- A big divergence between the Fed and other central banks. The Fed is probably nearing the end of its tightening cycle, for now, with a potential pause in March. Conversely, other central banks are just getting started with normalizing rates. The eurozone is expected to go in that direction at some point, while the UK and Canada continue their tightening cycle.
- While economic growth in the US has been showing signs of peaking, global markets might be nearer an economic contraction bottom. Chinese markets, which have been hit hard by the trade war, are likely to gain the most from a trade resolution and are thereby attracting dollar-based investments.
- US President Donald Trump plans to deliver a prime-time televised address on Tuesday as he battles Democrats over his proposed border wall.
- A US delegation is in Beijing for trade talks with Chinese officials, the first face-to-face encounter since Trump and Chinese president Xi Jinping agreed to a temporary truce on Dec. 1.
- North Korea’s leader Kim Jong Un is visiting China ahead of a potential summit with Trump.
- Wednesday sees the release of minutes from the Fed’s Dec. 18-19 policy meeting. Powell will speak to the Economic Club of Washington D.C. on Thursday.
- Britain’s Parliament resumes a debate on the Brexit withdrawal bill, with Prime Minister Theresa May seeking to avoid defeat in a vote set for the week of Jan. 14.
- Futures on the S&P 500 gained 0.3 percent, the highest level in more than three weeks.
- The STOXX Europe 600 increased 0.3 percent to the highest level in more than three weeks.
- The MSCI All-Country World Index fell less than 0.05 percent.
- The MSCI Emerging Market Index fell 0.6 percent.
- The Dollar Index gained 0.3 percent.
- The euro fell 0.2 percent to $1.1474.
- The Japanese yen dipped 0.2 percent to 108.72 per dollar.
- The British pound decreased 0.1 percent to $1.2777.
- The MSCI Emerging Markets Currency Index dropped 0.3 percent, the largest decrease in more than three weeks.
- The yield on 10-year Treasuries decreased less than one basis point to 2.70 percent.
- Germany’s 10-year yield gained one basis point to 0.22 percent.
- Britain’s 10-year yield advanced two basis points to 1.254 percent.
- The spread of Italy’s Italy 10-year bonds over Germany’s dipped one basis point to 2.678 percentage points.
- The Bloomberg Commodity Index climbed 0.2 percent, reaching the highest level in more than two weeks on its fifth straight advance.
- West Texas Intermediate crude gained 0.3 percent to $48.52 a barrel, hitting the highest level in three weeks with its seventh consecutive advance.
- LME copper slipped 0.3 percent to $5,923.00 per metric ton.
- Gold fell 0.4 percent to $1,289.21 an ounce.
Key Events
Futures on the S&P 500, Dow and NASDAQ 100 pointed to a firmer US open this morning and European shares edged higher, shaking off this morning's mixed Asian session as investors look to potentially dramatic developments between the world’s two largest economies, currently holding trade talks in Beijing.
The STOXX Europe 600 was led higher by technology companies and banks, despite a surprise miss for German industrial production, which raises worries about a key sector for the biggest economy in the euro area. The gauge fell 1.9 percent in November from October, falling short of the 3.0 percent expectation.
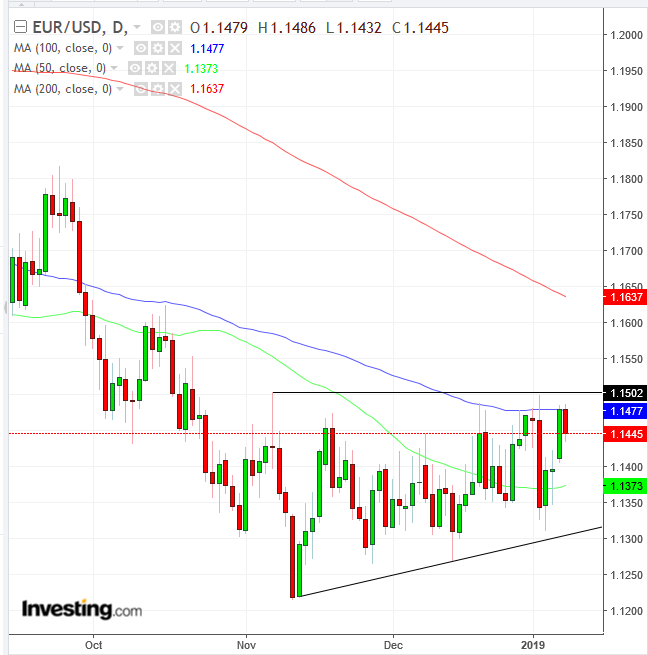
Stocks in the region likely received a boost from a falling euro, which was dragged lower by the disappointing data from Germany. The weaker single currency makes the continent’s exports more competitive in a global market mired by trade tensions. Technically, the euro is showing signs of bottoming out as it forms an ascending triangle. Meanwhile, the price found resistance by the pattern top and the 100 DMA.
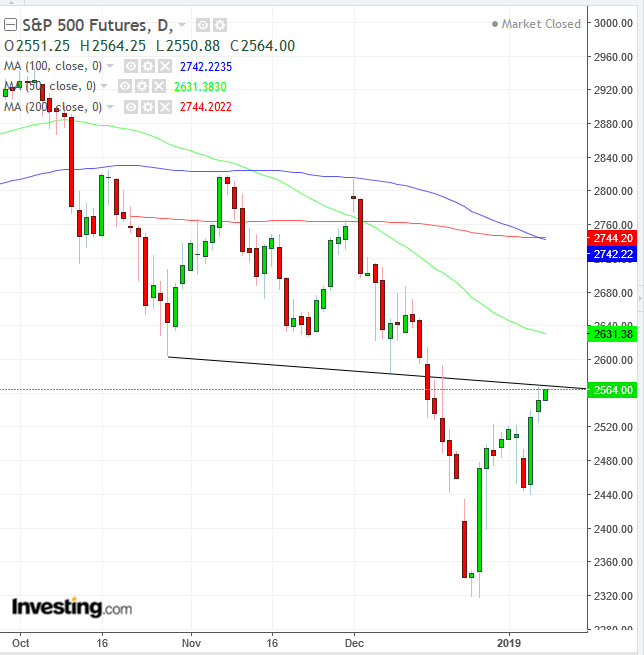
Futures contracts on all four US majors bounced at the European open, though they failed to climb higher than yesterday’s intraday highs. Also, they are all pushing against previous resistance levels that turned to support. S&P 500 contracts are retesting the consolidation bottom of October 29 through December 19, which seemed to have suppressed yesterday’s closing price. As well, the 100 DMA just crossed below the 200 DMA, suggesting prices are falling. It may create a snowball effect, in which technical traders increase supply.
Earlier, Asian indices partly gave up gains that had been triggered by optimism over a US-China trade agreement and a slowdown in the Fed’s pace of tightening. Trading in the region lost steam due to a strengthening dollar, which swayed investment away from emerging markets.
China’s Shanghai Composite closed 0.26 percent lower and South Korea’s KOSPI dropped 0.58 percent. Japan’s Nikkei rose 0.82 percent, Australia’s ASX 200 advanced 0.69 percent and Hong Kong’s Hang Seng edged up 0.15 percent.
Global Financial Affairs
Yesterday, stocks in the US inched higher for a second day, as US-China trade talks infused hopes that one of the most prominent market headwinds would be resolved, compounded by a robust jobs report and a dovish shift by the Fed. The S&P 500 climbed 0.7 percent, with the Consumer Discretionary sector (+2.26%) clearly leading the advance. Energy shares, buoyed by the sixth straight day of gains in oil, was still quite far behind, up 1.49 percent. Utilities (-0.68%) lagged alongside Consumer Staples (-0.14%).
The Dow Jones Industrial Average climbed 0.42 percent. The NASDAQ Composite ticked 1.26 percent higher and, ironically, the Russell 2000 jumped 1.82 percent, outperforming its peers.
We pointed out on Sunday that small caps have been outperforming, which is unusual considering that US and China finally appear to be on the right track to solve their tariff dispute. Apparently, the preceding rout made small caps relatively better valued.
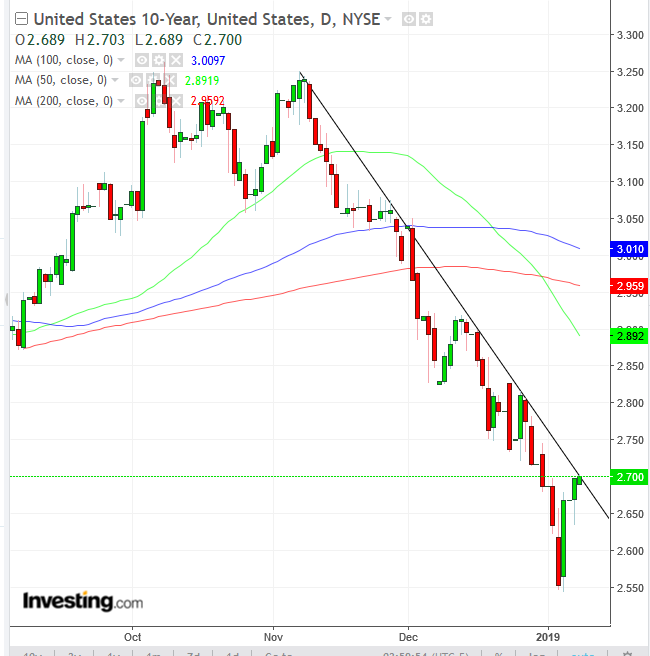
The yield on 10-year Treasurys rebounded, now testing yesterday’s highs, which found resistance by the downtrend line since November 17, when yields reached 3.250 percent—the highest since May 2011. Also, last week the 50 DMA crossed below the 200 DMA, triggering the much-feared Death Cross.
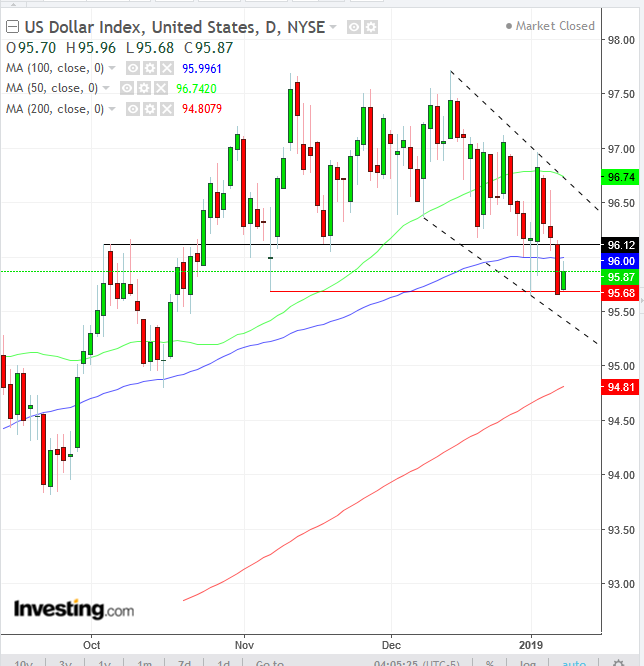
The dollar bounced back from yesterday’s 0.54 percent drop. There are two fundamental drivers that keep pressuring the greenback:
Technically, the USD rebounded today after finding support by the November 7 lows. Meanwhile, the primary support/resistance line since October 3 has been breached with a close 0.5 percent below—at the bottom of the session. Also, the dollar may find the support of the bottom of a descending channel since mid-December. The next major support is the 95.00 psychological area, supported by the mid-October lows and the 200 DMA.
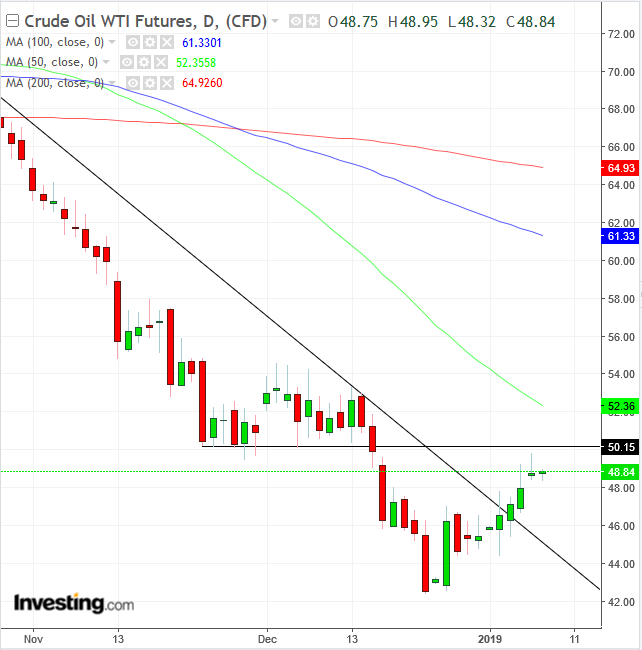
WTI prices are higher for the seventh straight session, on the Saudi plan to reduce exports by up to 800,000 barrels a day from November levels—despite warnings from US President Donald Trump. Technically, while the price ascended above the downtrend line since October 3 after nearing the $77 level, the highest since late 2014, yesterday’s candle produced a bearish shooting star, as it reached the November-December support-turned-resistance at the psychological $50 mark.
Looking at the overall picture for markets, fundamentally investors now face a dichotomy: they have to decide whether they want to rely on a solid US employment report and a potentially more dovish Fed, or remain cautious based on ongoing trade uncertainty, Brexit headwinds and a global economic slowdown, in the late phase of a business cycle. Adding to these risks is the fact that US lawmakers have been unable to reach an agreement on budget, causing the partial federal government shutdown to enter its third week.
Technically, we are bearish in the medium term, with the next big test being with the 200-week MA, which supported last month’s lows, on top of the long-term uptrend line since the 2009 bottom. Should those levels break, we will turn bearish in the long-term as well, expecting a full-fledged bear market.
Up Ahead
Market Moves
Stocks
Currencies
Bonds
Commodities
