- Strong jobs report, dovish Fed, US-China trade talks boost equities
- Yields ended lower, on broader risk-on, dragging down the dollar
- Weak dollar boosts gold, as well as oil
Despite Thursday’s equity market selloff on Apple’s (NASDAQ:AAPL) reduced revenue outlook on a slowing Chinese economy, US stocks finished higher ahead of the weekend, for a second week, after December's three-week losing streak. Friday’s rally was among the steepest in the last decade.
Stocks were boosted by a variety of catalysts including signs that the US economy is still robust via the monthly nonfarm payrolls release, a suddenly attentive Fed which seemed to be signaling the possibility of slower rate hikes and US-China trade talks that remain on track. With the return of risk-on sentiment, Treasuries weighed on the dollar, which, in an uncharacteristic move, fell together with gold and the Japanese yen.
Short and Longer Term Drivers Boost Markets
Equities spiked on Friday after nonfarm payrolls showed that 312,000 new jobs were added in December, signaling the US economy remains in good shape. That number was almost 90% better than expectations. The unemployment rate rose from 3.7 to 3.9 percent. On the face of it, a rising unemployment might be considered a negative, but since so many workers were returning to the workforce based on the added jobs, in this case it's actually positive.
Perhaps, however, the most positive metric in the release was wages, which grew by 3.2 percent from a year ago, tying with October's wage growth numbers for the largest year-over-year increase since April 2009. Consumer spending supports about 66% of US GDP making it a key economic force.
While monthly releases buoyed stocks short-term, Fedspeak will potentially have a longer lasting impact on equities. To calm markets, Fed Chair Jerome Powell backpedaled on his interest rate trajectory. The Fed chief said the central bank will be “patient” with normalization, emphasizing that “there is no preset path” for higher rates or adjusting the balance sheet.
The Fed boss made a rare observation about the market, saying the US economy is in strong shape; he further noted that he believes the market is pricing in "downside risks" that aren't visible yet. While expressing confidence in ongoing growth, Powell brushed off responsibility for the recent equity rout, shifting the blame, instead, to smart money, which may be acting on insight, dragging the herd behind it. He also said the Fed is "listening very carefully" to the market, after repeatedly saying previously that the Fed disregards market volatility both with regard to the state of the economy or the Fed’s path to tightening.
A third driver was the US team headed to China for trade talks, after the world’s two largest economies agreed to a 90-day hiatus on tariffs. At the same time, Beijing on Friday cut bank reserve requirements for a fifth time this year amid slowing growth at home and the punishing US tariffs on exports.
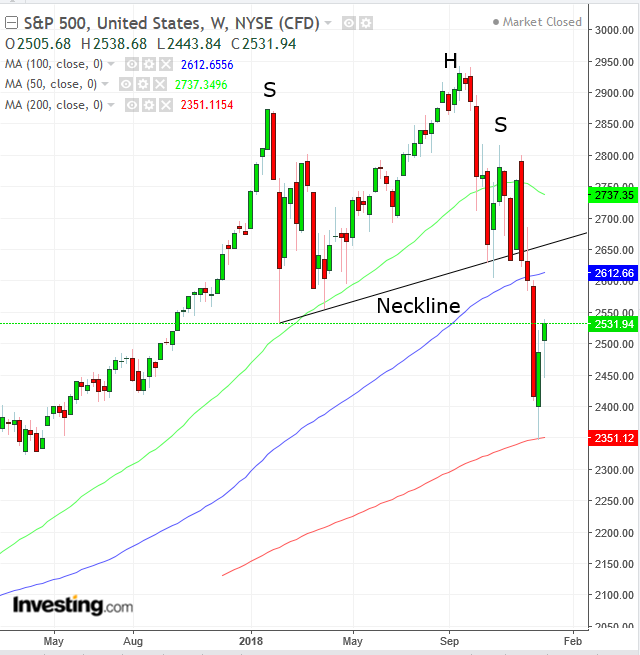
The S&P 500 Index jumped 3.43% on Friday, with all sectors gaining at least 1%. Real Estate (+1.02%) continued to underperform, having been hit the hardest by rising rates which would make mortgages more expensive. Technology (+4.43%) and Communications Services (+4.30%) shares resumed their market leadership positions, though this time higher.
For the week, the SPX (+1.86%) climbed along with Energy (+4.94%) shares, as trade talks and supply cuts boosted crude prices. Communication Services (+4.08%) followed, though once again Real Estate (-0.65) underperformed.
Over the course of the past two weeks the equity benchmark advanced 3.69 percent. Technically, the index found support at the 200-week MA, and is now squeezed between that and the 100 WMA. The S&P's rebound should be considered nothing more than a return move to retest the H&S top.
The Dow Jones Industrial Average rose on Friday, up 3.29%. The mega cap index saw a 1.6% gain for the week and a cumulative 4.39% boost for its two-week advance. Technically, like the S&P 500, the benchmark found resistance by the 100 WMA.
The NASDAQ Composite leaped on Friday, jumping 4.26%. It outperformed on both a daily and weekly basis, rising 2.34% for the week. This was also the second weekly rebound for the tech heavy index, with a total gain of 6.41% for the entire period, making it the leader on this metric as well.
Like the Dow and the S&P, the NASDAQ is trading within its 200 and 100 week MAs. Typically, trading becomes congested between the major MAs, especially the longer term moving averages. Often, when they squeeze out, they explode one way or another, but typically with great volatility.
The Russell 2000 closed higher by 3.28% ahead of the weekend, up 3.18% for the week and 6.84% for the two week period. That would make the small cap index the leader of this rally, both on a weekly basis as well as during the two week rebound. That fact is at odds with the market narrative that blamed the trade war as a key driver for selloffs when the trade dispute escalated.
Similarly, during the same period, while the US and China seemed to have their best run of trade talks, the Russell should have been the laggard, as the safe haven, anti-trade dispute proxy. Technically, the index managed to climb back above the 200 WMA.
Growth Peaks, Yield Curve Keeps Flattening
Overall, while growth remains robust, it has likely peaked, as seen via the jobs report, with its seventh largest monthly increase over the nearly 10-year expansion. As well, the results for the previous two months were revised upward, bringing the three-month pace of jobs created to a healthy 254,000 average.
Finally, after years of lethargic growth, wages jumped by 0.4 percent last month, for a 3.2% YoY gain, the fastest pace since 2009. However, all this occurs on the heels of historically low interest rates, and with the business cycle ending. The persistently flattening yield curve, as measured by the yield differential between the 2-year and 10-year Treasury notes, also reflects investors’ outlook for the end of growth.
The technicals, which often indicate reversals before the fundamentals, already show most global stock indices are in a bear market. In the US, the NASDAQ indices and the Russell 2000 are in bear markets, while the S&P and Dow have managed to barely keep from falling to the accepted 20% standard for a bear market. Nevertheless, both remain in downtrends with volatility levels suggesting they're already in bear territory.
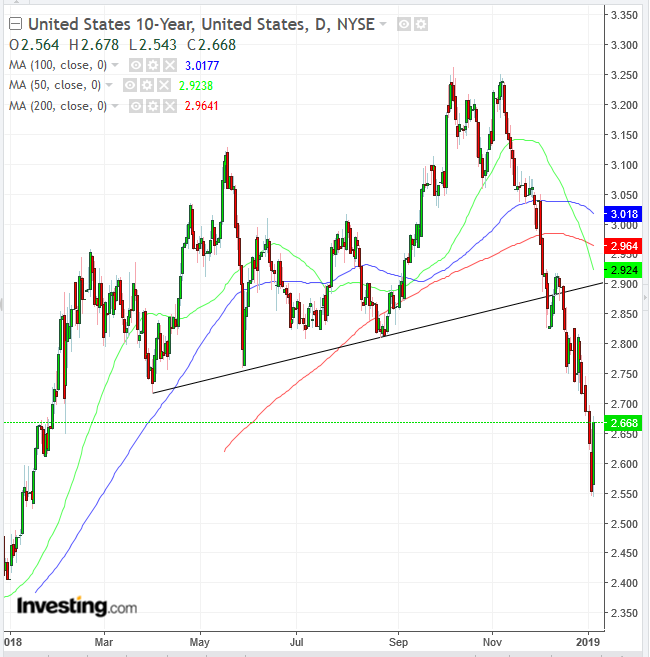
Trump adviser Kevin Hasset, who is chairman of the White House Council of Economic Advisers, noted Friday that while typically an inverted yield curve is a recession indicator, this time it’s not reliable since QE has depressed yields on the long end of the curve. While this argument may have merit, it’s suspect coming from a White House adviser, who is required to support his boss. Last week, 10-year yields triggered a Death Cross when the 50 DMA crossed below the falling 200 DMA, whose bearish sign is especially potent. Yields topped out last month.
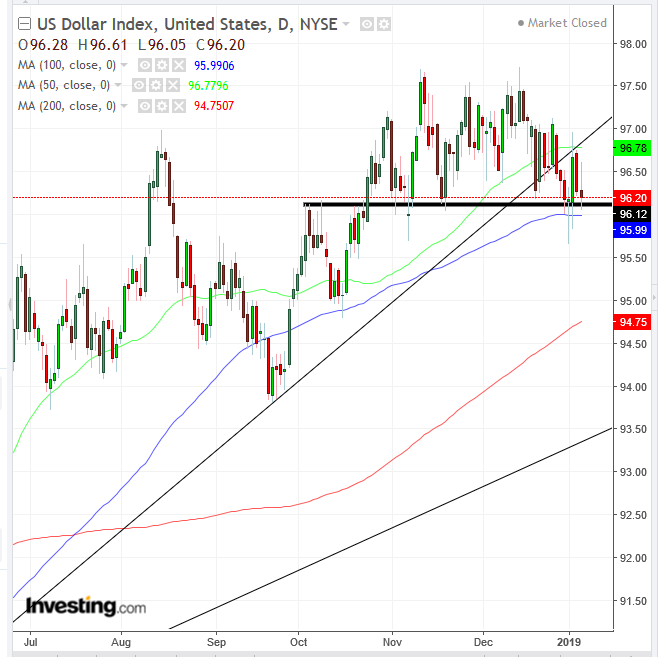
The dollar, dragged down by falling yields, has been showing signs of a top for some time. It fell below its uptrend line since mid-April and the 50 DMA, as it failed to make a new high above the 97.50 level.
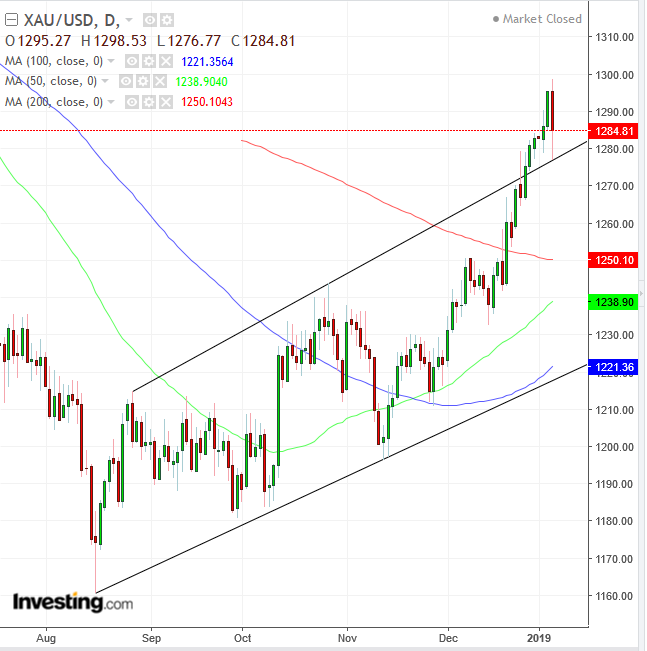
Gold broke to the upside of a rising channel. Friday’s USD selloff found support precisely at the top, demonstrating a resistance-support reversal, with the 50 DMA rising toward the 200 DMA for a possible Golden Gross—all in support of a dollar top.
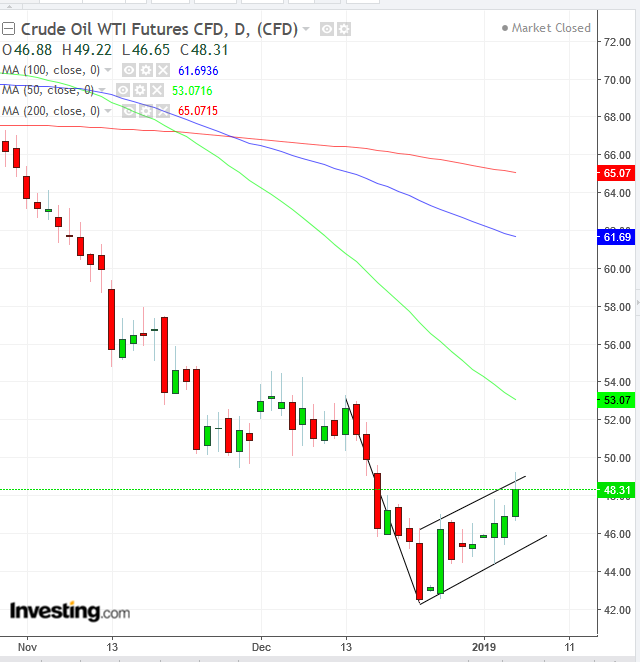
Oil, which had been rising on signs that Saudi Arabia might be cutting production, received an additional boost Friday after China's announcement it would be holding trade negotiations with the US. Crude received a secondary boost from Friday's renewed risk-on sentiment. Technically, however, the price failed an upside breakout to a bearish pattern.
The Week Ahead
All times listed are EST
Monday
10:00: US – ISM Non-Manufacturing PMI (December): forecast to fall to 59.6 from 60.7.
10:00: Canada – Ivey PMI (December): expected to rise to 58.1 from 57.2.
Tuesday
8:30: US – JOLTs Job Openings (November): to rise to 7.170M from 7.09M.
Wednesday
2:00: Germany – Trade Balance (November): surplus to rise to €17.6 billion from €17.3 billion.
5:00: Eurozone – Unemployment Rate (November): forecast to hold at 8.1%.
7:30: UK – Parliament begins debate on Brexit Withdrawal Bill: the House of Commons will begin a fresh round of debate on the UK’s proposed withdrawal agreement from the EU. This should culminate in a vote in parliament some time during the following week.
10:00: Canada – Bank of Canada Rate Decision: no change expected from the current 1.75% rate.
10:00: UK – BoE Governor Carney Speaks as Brexit anxiety drags UK economy to a standstill.
10:30: US – EIA Crude Oil Inventories (w/e 4 January): to fall -3.086 million barrels from 0.007M.
20:30: China – CPI (December): expected to edge down to 2.1% from 2.2% YoY.
Thursday
7:30: Eurozone – ECB Publishes Account of Monetary Policy Meeting: these will provide further insight into the views of the European central bank.
10:00: US – (Tentative) New Home Sales (November): forecast to rise 2.9% MoM from a 8.9% drop a month earlier. Having declined steadily throughout 2018, US housing data is now a key metric for investors.
Friday
4:30: UK – GDP and Trade Balance (November): growth to hold at 0.1% over the three months to the end of November, while trade deficit to narrow to £11.40 billion from £11.87 billion.
8:30: US – CPI (December): core prices expected to rise 2.2% YoY, in line with last month, and 0.2% MoM, up from 0.2%.
