Monday February 13: Five things the markets are talking about
Stateside, the markets attention this week turns to Fed Chair Yellen semi-annual testimony in Congress (Feb 14th and 15th 10:00 EST). Investors will be looking for more clues on how probable are the expectations of a March rate hike.
Note: The last FOMC decision has dented those probabilities (+21%) due the uncertainty with the fiscal side of the U.S economy. On the weekend, Fed vice chair Fischer stated that there is “significant uncertainty about what Congress and the Administration will do with fiscal policy.”
Elsewhere, there are no central bank meetings this week, but the ECB’s minutes from January’s meeting will be released on Thursday. Expect investors to study the text for policy clues going forward.
Internationally, the Eurozone, Germany, Italy and Japan will report GDP data, while price data, both consumer and producer, again will give the market a better understanding on global “inflation.”
After Canada’s ‘phenomenal’ jobs report on Friday, other commonwealth countries get their opportunity this week – UK and Australia.
1. Equities get the green light
The “Trump trade” is on the rise again, supporting global stocks and bond yields as investors bet that the U.S. president’s tax reform plans will boost economic growth and corporate profits.
Following on from Friday’s record high closes on Wall Street, Asian equities overnight have rallied to an 18-month, while euro stocks rise for the fifth consecutive session this morning, their longest winning stretch for two months.
In Japan, the Nikkei share average rallied to a two-week high overnight, supported by a weaker yen (¥114.00) and relief that talks between U.S. and Japan yielded no negative surprises. The Nikkei gained +0.4%, while the broader Topix gained +0.5%.
In Hong Kong, shares closed at a four-month high, supported by the materials sector following a rally in commodities prices and capital flows from the mainland. The Hang Seng index rose +0.6%.
In China, the main stock indexes rose for their fourth straight day of gains to a fresh two-month high, as the materials sector underpinned the market. The blue-chip CSI300 index rose +0.7%, while the Shanghai Composite Index gained +0.6%.
In Europe, the Stoxx 600 has added +0.2%, heading for a fifth straight gain for the longest winning streak of the year, mostly supported by financials. While mining stocks have dragged the FTSE 100 higher at the open, with metals prices behind the sector’s gains.
U.S. stocks are set to open in the black (+0.1%).
Indices: Stoxx50 +0.4% at 3285, FTSE flat at 7259, DAX +0.5% at 11731, CAC 40 +0.6% at 4857, IBEX 35 +0.3% at 9405, FTSE MIB +0.5% at 18947, SMI flat at 8454, S&P 500 Futures +0.1%
2. Oil falls on rise in U.S. drilling
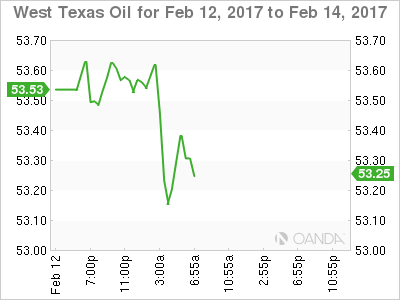
Crude oil prices start the week on the back foot in response to growing evidence that U.S. production is rising and as some investors unwound positions ahead of OPEC’s first report on compliance with its deal to cut production.
Brent crude futures are down -45c at +$56.25 a barrel, while West Texas Intermediate (WTI) crude slipped -41s to +$53.45 a barrel.
The Crude ‘bull’ feels a tad more comfortable liquidating ahead of the release of the monthly OPEC report (due out shortly). Also providing pressure, another increase in U.S. rig counts.
Note: U.S. oil drillers have added the most drilling rigs since 2012 over the past month, bringing the total count to 591 rigs, the most since October 2015 (Baker Hughes weekly report).
This rise in U.S. activity comes just as some oil producers are reducing output to reverse global oversupply in a bid to prop up prices.
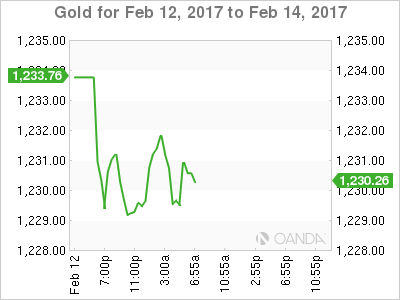
Gold sees red (-0.31% to +$1,230.22) as the dollar strengths on the back of a smooth meeting between Trump and PM Abe that saw no mention of currency policy.
3. Sovereign yields back up, a tad
U.S. Treasuries have extended losses after Friday’s January import prices came in higher than expectations.
Note: Prices were already slightly lower before the report, holding their momentum from when President Trump halted a three-day rally by suggesting he would unveil a tax overhaul plan within the next three weeks.
Fed Chair Yellen testifies before Congress this week with the opportunity to reset currently low expectations about the possibility of a March interest-rate increase.
U.S 10-year Treasury notes have backed up +1bps to +2.42%.
In Germany 10-year bond yields have increased +2bps to +0.33%, while France yields have increased +5bps to +1.03%.
Note: The fear of “Frexit” – France’s far-right candidate Marine Le Pen presented her program for such an exit yesterday – should continue to widen periphery/bund spreads.
Down-under, Aussie 10-year bonds have declined, pushing yields up +1bps to +2.71%.
4. Dollar finds some mojo, but not much
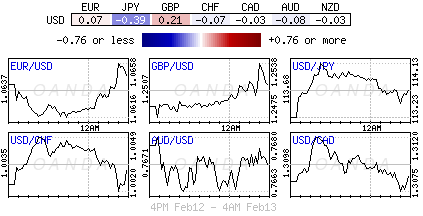
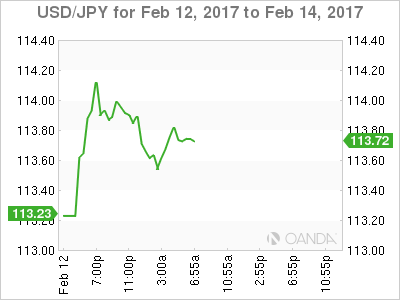
With the market focus again shifting to President Trump’s plan to overhaul business taxes and not criticizing Japan’s currency policy saw the USD print a two-week high outright against yen overnight (¥114.16) before retreating towards the ¥113.70 ahead of the U.S open.
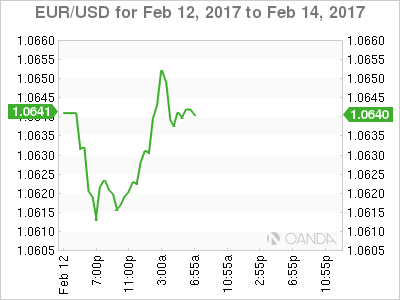
The EUR again has held its key support at the €1.06 and remains confined to a tight trading range, trading atop of the €1.0645 area. Dealers have been noting that technical momentum would likely to rise on the break of €1.0600 area on a sustained basis.
Sterling is holding ahead of the £1.2525 level with some key data out of the UK this week (CPI on Tuesday, Jobless claims on Wednesday). The market remains cautious that future data could start to show bigger signs of weakness ahead of the March trigger of Article 50 for the Brexit process. Pound bears are looking to sell on dollar weakness.
5. E.U raises growth forecasts, amid risks from Brexit and Trump
Earlier this morning, the EU raised their economic growth forecasts for 2017 – they are predicting growth across the bloc even as it faces mounting political risks and uncertainties.
The European Commission said the bloc had shown its “economic resilience to shocks last year, when the UK voted to leave the union.”
In the latest of its projections (published three times a year), the commission said growth in the 28-country EU was expected to be +1.8% in 2017, up from +1.6% forecasted in November.
EU officials also increased their 2016 growth expectation to +1.9% from +1.8% while keeping their estimate for 2018 steady at +1.8%.
Note: This morning’s report come with the usual disclaimer – global uncertainties – Trump’s stance on key policy areas and the UK’s plan to trigger Brexit talks next month – means that “downside risks have increased” to the bloc’s forecasts.
