Technical AnalsysTechnical Analysis #C-ROBUSTA : 2019-05-21
The number of coffee houses is growing in China
The Chinese chain of coffee houses Luckin Coffee (NASDAQ:LK) has successfully placed its shares on the American stock exchange Nasdaq Global Select Market. Will the Robusta coffee quotations increase?
Robusta coffee is mainly grown in Vietnam, which borders with China. Investors praised the prospects of the company Luckin Coffee. After the IPO, its shares soared by 47%. Theoretically, we can assume an increase in coffee consumption in China. In early May, domestic quotations for Robusta coffee in Vietnam collapsed to a 6-year low. Due to this, the shipment of coffee this month has decreased by about 1.5 times compared with April. In the world market, the cost of Robusta also has fallen to a 9-year low at the beginning of May and Arabica coffee to a 14-year low. U.S. The Department of Agriculture has published a forecast on the export of coffee from Ecuador. It is expected to decrease by 35% in the agricultural season 2018/19 compared with the season 2017/18 and then another 10% in the season 2019/20 compared with the season 2018/19. Falling world prices for coffee can affect its production and export in other countries. So, the agency Conab expects a reduction in coffee yield in Brazil this year by 17% to 50.9 million bags (60 kg) compared to last year. At the same time, the area of coffee crops in Brazil in 2019 turned out to be minimal since 2007.
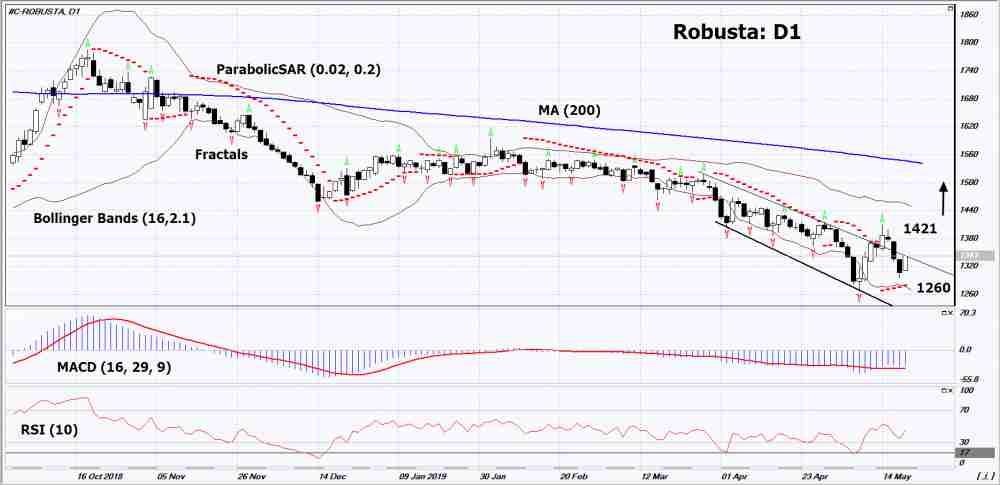
On the daily timeframe, Robusta: D1 again is close to the resistance line of the downward trend. Before opening a buy position, it must be pierced to the top. Various technical analysis indicators have generated uptrend signals. Further growth of quotations is possible in case of reduction in world production and with an increase in demand.
-
The Parabolic indicator demonstrates signal to increase..
-
The Bolinger® bands widened, indicating high volatility.
-
The RSI indicator is above the 50 mark. It formed a weak divergence to the rise.
-
The MACD indicator shows an uptrend signal .
The bullish momentum may develop if Robusta exceeds the last two upper fractals: 1421. This level can be used as an entry point. The initial stop loss may be placed below the last lower fractal, the minimum since March 2010, the lower Bollinger line and the Parabolic signal: 1260. After opening the pending order, we shall move the stop to the next fractal low following the Bollinger and Parabolic signals to the next fractal minimum. Thus, we are changing the potential profit/loss to the breakeven point. More risk-averse traders may switch to the 4-hour chart after the trade and place there a stop loss moving it in the direction of the trade. If the price meets the stop level (1260) without reaching the order (1421), we recommend to close the position: the market sustains internal changes that were not taken into account.
Technical Analysis Summary
- Position Buy
- Buy stop Above 1421
- Stop loss Below 1260
Market Overview
S&P 500 falls led by technology
Dollar weakens after weak Chicago Fed index report
US stock market pullback continued on Monday led by technology shares hurting from ban on business with Huawei Technologies. The S&P 500 lost 0.7% to 2840.23. Dow Jones industrial slid 0.3% to 25679.90. The Nasdaq composite tumbled 1.5% to 7702.38. The dollar weakened after data showed Chicago Fed’s national activity index slipped to a negative 0.45 in April, down from an upwardly revised positive 0.05 in March: the live dollar index data show the ICE (NYSE:ICE) US Dollar index, a measure of the dollar’s strength against a basket of six rival currencies, edged down 0.03% to 97.93 but is higher currently. Futures on US stock indexes point to higher openings today.
DAX 30 suffers heaviest loss among European indexes
European stocks slide accelerated on Monday as slump in technology shares dragged equity markets. Both EUR/USD and GBP/USD turned higher but are lower currently. The Stoxx Europe 600 index declined 1.2% with technology sector dropping 3%. The DAX 30 fell 1.6% to 12041.29. France’s CAC 40 tumbled 1.5%. UK’s FTSE 100 lost 0.5% to 7310.88.
Shanghai Composite leads Asian indexes gains
Asian stock indices are mixed today. Nikkei closed 0.1% lower at 21272.45 despite enduring yen slide against the dollar. Markets in China are mixed despite news US has decided to extend 90-day exemptions to some US companies from the technology export ban announced last week: the Shanghai Composite Index is up 1.2% while Hong Kong’s Hang Seng Index is 0.1% lower. Australia’s All Ordinaries Index extended gains 0.4% as Australian dollar resumed its slide against the greenback.
Brent up
Brent futures prices are edging higher today on US-Iran tension with global markets slump capping gains. Prices fell yesterday despite Middle East tensions: July Brent crude lost 0.3% to $71.97 a barrel on Monday.


