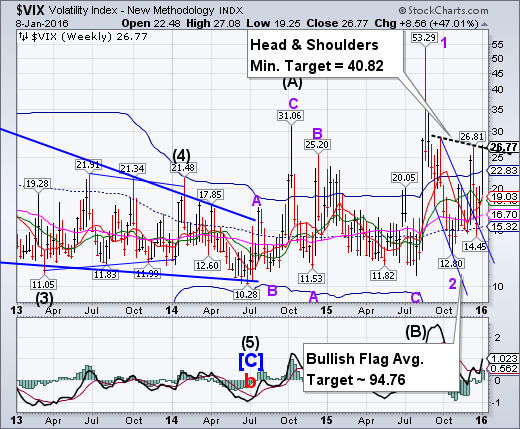
VIX closed the week just above a new Head & Shoulders neckline at 26.81. This is at the same level that VIX closed on August 21. It remains on a buy signal (NYSE sell signal). The neckline crossing may trigger a move as robust ore more so than the August 24 spike high.
(BusinessToday) Volatility index VIX rose to highest level since December 15 on Thursday after headline indices fell to their lowest level since December 14 post rout in Chinese markets.
The fear gauge rallied as much as 8.23 per cent in less than one hour of trading.
Who could have seen this coming?
SPX fails at the 4.25-year Trendline, Approaches Neckline
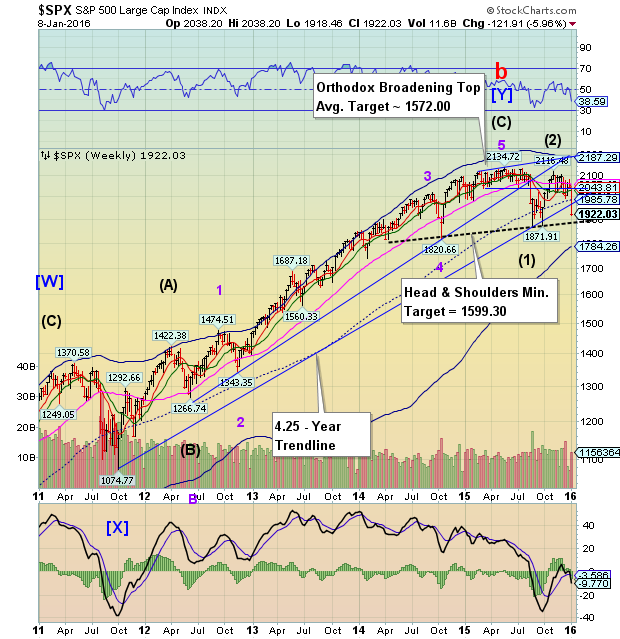
The SPX declined through its 4.25-year trendline at 1957.00 and is now approaching a massive Head & Shoulders neckline at 1885.00. The Broadening Top formation also apppears to have been triggered with the same approximate consequences as the Head & Shoulders formation. SPX is on a sell signal. We may see a brief bounce at the neckline, but the decline may go longer than many expect.
(USAToday) The U.S. stock market -- off to its worst start to a year ever -- saw an early rally fizzle out and finished sharply lower Friday after a big late-day selloff, dashing hopes for a market rebound despite a strong U.S. jobs report and a 2% rebound in Chinese stocks that had provided a brief but short-lived respite to a turbulent, historic week of trading.
The Dow Jones industrial average closed down 167.65 points, or 1.02%, to 16,346.45, putting it more than 10% below its record close last May and back in correction territory.
NDX breaks Long-term support.
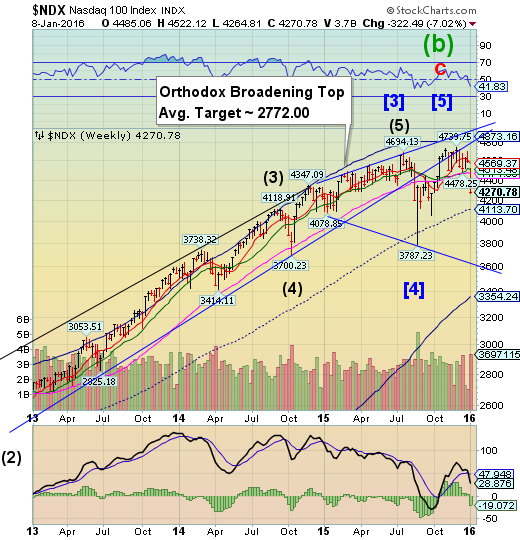
NDX has broken below its weekly Long-term support at 4471.86 this week. The next level to be challenged is the weekly mid-Cycle support at 4113.70. Once mid-Cycle support is crossed, the potential Orthodox Broadening Top formation may imply a possible move to the Cycle Bottom support at 3354.24, or lower.
(Fortune) Tech stocks have been hammered this year.
Markets stabilized this morning, following an upturn in Shanghai. But the first four trading days mark the worst start of a year ever for the Dow and S&P 500.
The markets have fallen out of love with tech companies. Among those pummeled has been Fitbit N:FIT 0.09% , which lost almost a third of its value since the New Year, and half since its peak last summer. Fitbit CEO James Park was at the Leaders in Technology dinner at CES last night, and took a philosophic pose: “All we can do is focus on what we can control, and what we can control is launching great products. The stock price will take care of itself.” (Park also narrowly lost his Fitbit challenge with CES maestro Gary Shapiro.)
High Yield Bonds breaks through all supports.
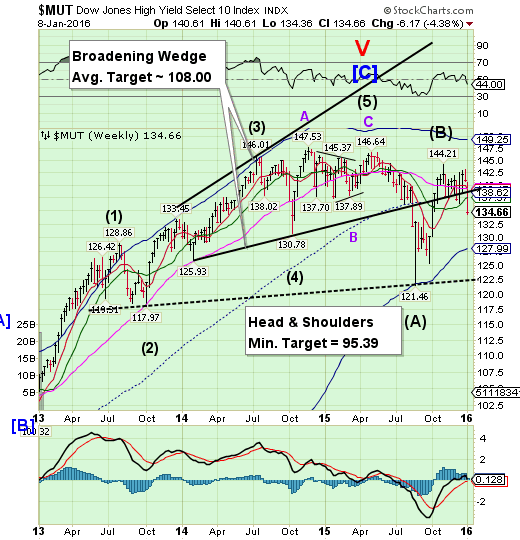
The High Yield Index declined beneath the trendline of its Broadening Wedge and mid-Cycle support at 138.362. The next level of support is the weekly Cycle Bottom support at 127.99. Once broken, the last level of support may be the neckline of the Head & Shoulders formation near 122.50. MUT is on a sell signal.
(Reuters) The embattled US high-yield market has struggled to get back on track in the first week of 2016, after three issuers bypassed public bond sales in a sign of more trouble for the asset class.
The junk-bond sector, which delivered a net loss in 2015, now faces renewed questions about the extent of demand for what is believed to be a US$90bn pipeline of bond and loan deals.
The euro may have completed its consolidation.
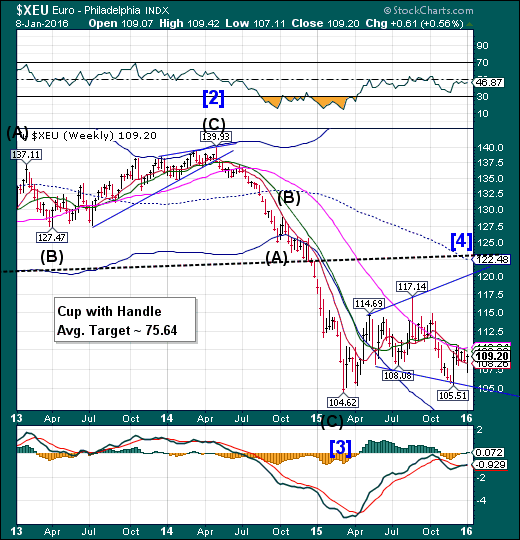
The euro may have finished consolidating beneath Long-term resistance at 110.34. Once above the resistance zone, it is likely to target the 117.00 – 120.00 range before reversing down. It is these kinds of retracements that shake out the weaker short sellers. Investment banks are backing away from the euro/dollar parity idea for now.
EuroStoxx closes at the neckline.
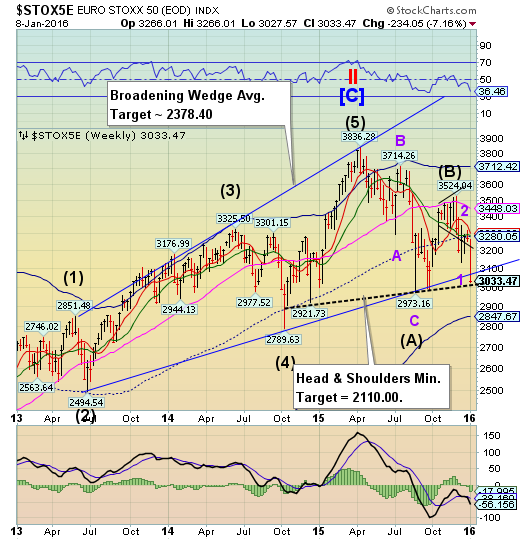
EuroStoxx declined through several support levels to close at the Head & Shoulders neckline near 3025.00. Should the new low be broken, EuroStoxx may remain in a decline through the third week of January.
(CNBC) European stocks finished in negative territory on Friday, in what has been a turbulent week for markets, as investors focused on China, oil prices and a strong monthly jobs report in the U.S.
The pan-European STOXX 600 ended trade down 1.3 percent provisionally, with almost all sectors closing lower. On the week, the STOXX 600 was down 6.6 percent provisionally, its largest weekly percentage loss since August 2011 during the European debt crisis, when it fell 9.94 percent.
The yen has lift-off.
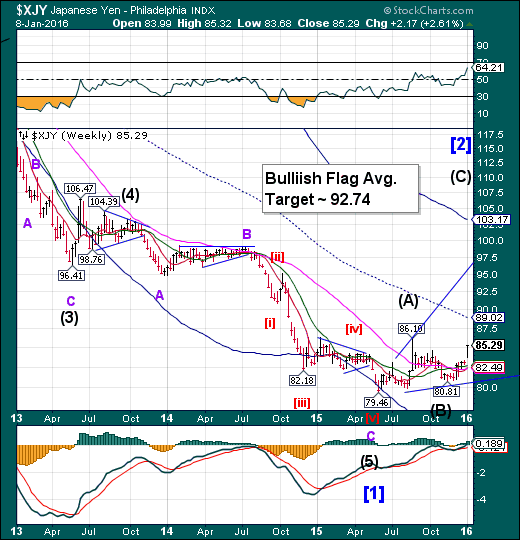
The yen gapped higher on Monday and hasn’t looked back. Its implied target may be at or above mid-Cycle resistance at 89.02. Should the yen resume its uptrend, it may continue its rally through the month of January.
(Bloomberg) Hedge funds and other large speculators are bullish on the yen for the first time in more than three years.
Positions that profit from yen gains against the dollar outnumbered bearish positions by a net 4,103 contracts in the week to Jan. 5, according to data from the U.S. Commodity Futures Trading Commission. That’s the first time since October 2012 the data haven’t shown net short positions.
The Nikkei declines to mid-Cycle and neckline support.
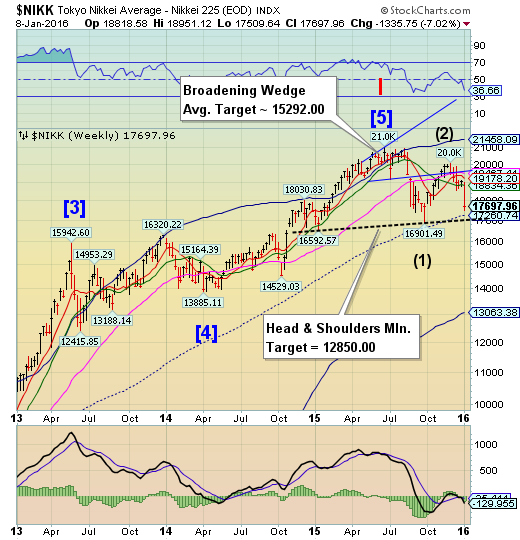
The Nikkei declined through its weekly Intermediate-term support at 18834.36 to close near its weekly mid-Cycle support at 17260.74. A further decline beneath its Head & Shoulders neckline may trigger panic selling, since the neckline represents support that held the lows for the past 15 months.
(Bloomberg) Japanese stocks fell as China’s decision to maintain the level of its currency for the first time in nine days failed to stop the Nikkei 225 Stock Average posting its worst first week of a year since 1997.
The Topix index dropped for a fifth day, losing 0.7 percent to 1,447.32 at the close in Tokyo. It swung from a 1 percent advance as tire makers led gains and utilities fell. The Nikkei 225 Stock Average lost 0.4 percent to 17,697.96, taking its weekly retreat to 7 percent. Fast Retailing Co. (OTC:FRCOY), which is the gauge’s biggest stock, slumped after cutting its earnings forecasts. The yen weakened 0.6 percent to 17.70 per yuan in offshore trading, the first decline since Dec. 30.
U.S. dollar may have finished its bounce.
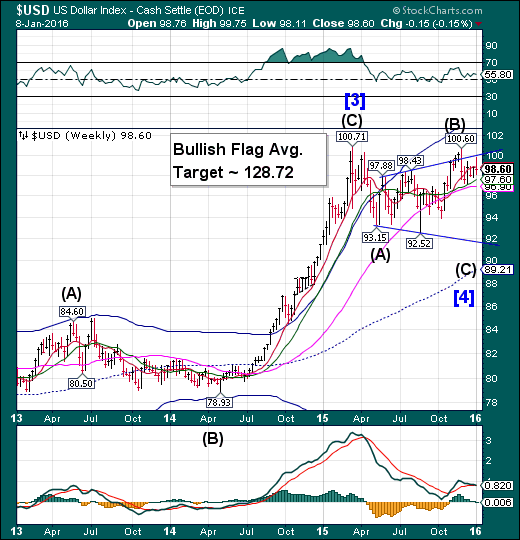
The US dollar rallied probed higher toward the upper trendline of its Broadening Flag formation before reversing lower. The Cycles Model calls for a pullback that may decline to trendline support near 92.00, once Long-term support at 96.90 is broken. A new Master Cycle low targeted for the end of January may bring USD down substantially in January, but the total move may not be complete until late March. Bullish speculators may be caught the wrong way in their positions, causing a panic among the longs as this decline has the potential of wiping out all 2015 gains in the dollar long position. There is a lot of potential fuel to make this happen.
(FiscalTimes) The value of the dollar's net long position slid to $28.78 billion in the week ended Jan. 5, from $31.80 billion in the previous week. This week's net longs were the lowest since Nov. 3, according to Reuters estimates.
It was also the second straight week speculators reduced their net longs on the dollar.
Investors this week have been spooked by turmoil in China's stock market and its currency the yuan, which spurred concerns that the Federal Reserve may have to further slow the pace of its tightening policy. That's a dollar-bearish scenario and may have contributed to the unwinding of long-held dollar net longs.
USB rallies from its trendline.
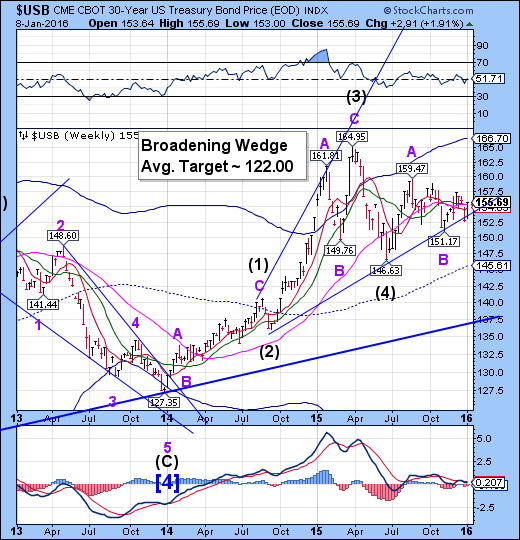
The Long Bond bounced from its weekly Long-term support at 153.00 before breaking above its weekly Long-term support at 155.44. We may see a rally in the Long Bond lasting through the third week of January before the next pullback.
(WSJ) The bond market didn’t budge as the U.S. economy added nearly 300,000 jobs last month.
The yield on the benchmark 10-year U.S. Treasury note briefly rose to 2.197% after the December employment report. But the yield quickly retreated as persistent worries over the global economy and global stock markets drove investors into the safe harbor of U.S. government debt.
At the end of the session, it closed at 2.131%, the lowest level since Oct. 28, compared with 2.153% Thursday. Bond yields fall as their prices rise.
Gold may have finished a retracement.
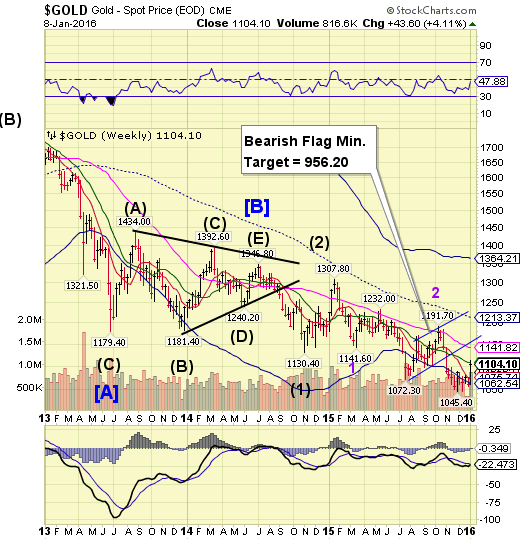
Gold challenged its weekly Intermediate-term resistance at 1107.74, then closed beneath it. The retracement may be over, due to the loss of Cyclical strength. The decline may resume in earnest for another three weeks or so before the next bottom may be found. Prepare for a strong decline ahead.
(TheWeek) Gold gained around 4 per cent overall and overnight in Asia, hitting a nine-week high above $1,110 an ounce, with prices benefiting from major upheaval on the stock markets this week.
The spot gold price touched $1,112 during the session in Singapore, its highest since the beginning of November, but fell back sharply to around $1,097 this morning amid a recovery for Chinese equities after Beijing allowed some appreciation in the yuan. Questions are now being asked over whether its "safe-haven" rally is over and done.
Crude declines through the neckline.
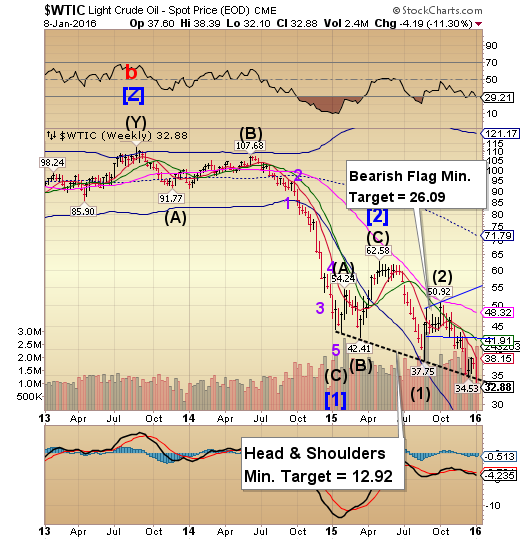
Crude declined through the Head & Shoulders neckline at 34.00. This is a very left-oriented Cycle pattern, implying extreme bearishness. The probability of a decline to the Flag target is running high. The Cycle Bottom Support is at 22.41 supports this view. Note the new Head & Shoulders neckline that is down-sloping and bearish.
(Reuters) Oil fell for a fifth straight day on Friday, losing 10 percent on the week, and Goldman Sachs (N:GS) said more losses were needed to force producers to cut supplies adequately to balance the glut and bleak demand outlook in the market.
Futures of global oil benchmark Brent and U.S. West Texas Intermediate (WTI) crude seesawed through the day, settling slightly lower after stock prices on Wall Street gave up their earlier strength. The two benchmarks hit 12-year lows earlier in the week after China's stock market crash roiled global markets.
Shanghai Index begins the new decline in earnest.
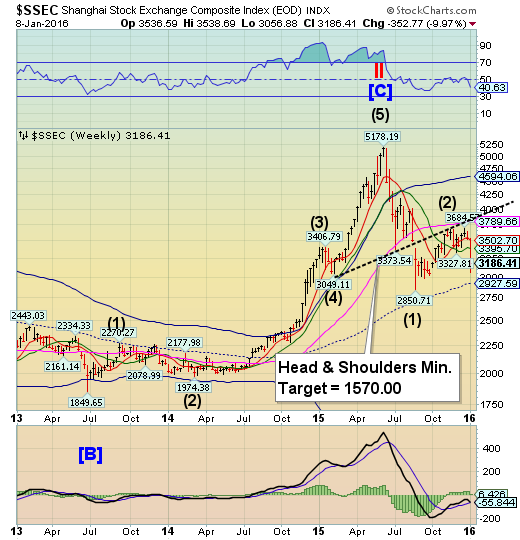
The Shanghai Composite Index has begun its decline in earnest this week. The Cycles Model suggests approximately another two weeks of decline. Any bounce should be used to sell until the decline is finished.
(ZeroHedge) It may be Saturday, but there is no rest for the onslaught of negative data from China, which overnight reported the latest, December, consumer and producer price inflation numbers, with the former printing at 1.6% Y/Y, matching consensus estimates, and a tiny increase from the 1.5% in November: the modest pick up was due to one-time items, primarily vegetable prices. For all of 2015, CPI rose 1.4%, down from 2.0% in 2014, and the slowest annual increase since 2009 and well below Beijing's goal of keeping last year's inflation below 3%.
It was wholesale inflation which again was the more troubling of the two prints, with PPI declining at 5.9% for the 5th consecutive month, below the -5.8% consensus, and printing negative for almost 4 years, or 46 months, in a row, highlighting the deeply entrenched pressures facing China's manufacturers as the economy cools. The biggest contributors to the PPI drop were extraction and raw materials, which plunged by 19.7% and 10.3% over the past year, respectively. For all of 2015, the PPI fell 5.2% compared with a decline of 1.9% in 2014.
The Banking Index declines beneath the neckline.
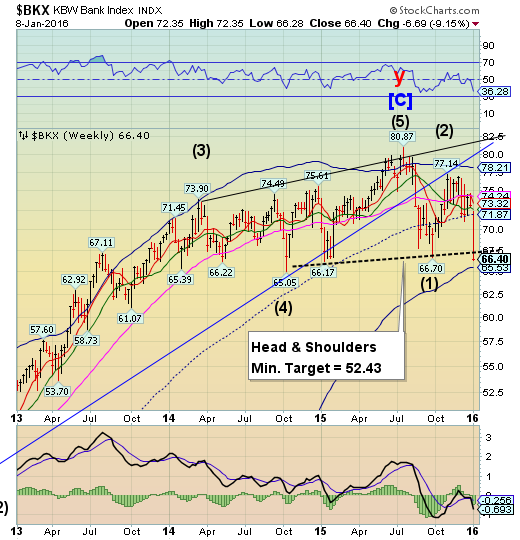
--BKX fell beneath its massive neckline, which extends from the October 15, 2014 low. It may consolidate briefly at the Cycle Bottom at 65.53.Beneath that is an implied message that BKX may retrace to its October 2011 low. Remember, BKX is a leading index.
(ZeroHedge) Something unexpected happened on the road to the latest Greek "recovery:" the local population no longer believes one is coming.
As Greece remains crippled by unprecedented capital controls preventing full access of the local population to its savings as a result of last summer's "referendum" and third bailout fiasco, and as Greek Prime Minister Alexis Tsipras braces for another round of tough negotiations with creditors, "savers are still reluctant to bet their money that this year’s talks will be less perilous for their country’s place in the euro area than 2015," as Bloomberg puts it.
A less diplomatic way of saying it is that while the bank run has been forcibly stopped, the bank "jog" continues.
(ZeroHedge) To some it is the independent and impartial Swiss National Bank; to others it is the world's biggest hedge fund with $584 billion in assets or about the same as the Swiss GDP, whose former chief suddenly resigned in 2012 following a family FX trading scandal.
Whatever it is, the SNB had an abysmal year: first and foremost it was its terrible bet on maintaining a EUR/CHF floor which imploded almost exactly a year ago, when the bank was forced to scrap its attempts to keep the Swiss franc weak, in the process suffering tens of billions in losses.
Then it was its unprecedented buying spree of US stocks, which in the first quarter of 2015 saw the SNB become one of the world's biggest buyers, and holders, of O:AAPL. Since then the stock price entered a bear market, having tumbled to levels not seen since late 2014.
(ZeroHedge) Nearly 7 years ago, shortly after Mark-to-Market was indefinitely suspended, and Mark-to-Unicorn as we first dubbed it was revealed, we described an odd accounting peculiarity which in the coming years would take the financial world by storm: the so-called "Fair Value Option", and its practical offshoot, the Credit/Debt Value Adjustment (CVA or DVA).
