VIX rallied out of its Master cycle low of December 21.It made a daily buy signal, but closed beneath its weekly resistance cluster between 14.16 and 14.36.The breakout above the resistance zone implies higher targets to come.
S&P 500 declines to its Cycle Top support.

SPX reversed from the upper trendlines of two Orthodox Broadening Top to challenge its weekly Cycle Top support at 2236.01.It closed above that support.The smaller Broadening Top chart pattern suggests a decline to 2000.00 or possibly lower may come very soon.
(ZeroHedge) When we first warned 8 days ago that in the last week of trading a "Red Flag For Markets Has Emerged: Pension Funds To Sell "Near Record Amount Of Stocks In The Next Few Days", and may have to "rebalance", i.e. sell as much as $58 billion of equity to debt ahead of year end, many scoffed wondering who would be stupid enough to leave such a material capital reallocation for the last possible moment in a market that is already dangerously thin as is, and in which such a size order would be sure to move markets lower, and not just one day.
Today we got the answer, and yes - pension funds indeed left the reallocation until the last possible moment, because three days after the biggest drop in the S&P in over two months, the equity selling persisted as the reallocation trade continued, leading to the S&P closing off the year with a whimper, not a bang, as Treasurys rose, reaching session highs minutes before the 1pm ET futures close when month-end index rebalancing took effect.
The NDX reverses from the Orthodox Broadening Top.

NDX made a new all-time high on Monday at the upper trendline of its Orthodox Broadening Top, but it was all downhill for the rest of the week.It has crossed beneath its Cycle Top support at 4923.28, giving it an aggressive sell signal. A further break of the weekly Short-term support at 4827.14 confirms a sell signal.
(CNBC) U.S. stocks finished 2016 with a thud on Friday after all three major indexes ended the year with three straight days of losses for the first time since Nov. 4.
The Dow, S&P 500 and NASDAQ Composite all finished the year higher, however.
The market weakened further as traders speculated that a large number of orders to sell had been placed. Art Cashin, director of floor operations at UBS, said the selling orders totaled about $1.2 billion.
Still, investors were looking ahead to 2017. Kevin Mahn, president and chief investment officer at Hennion & Walsh Asset Management, said investors will be optimistic going into the new year, but it's possible some of next year's gains may have already been priced in to this year's market.
High Yield Bond Index reverses beneath its Cycle Top.

The High Yield Bond Index continued its decline beneath its Cycle Top resistance at 165.83,giving an aggressive sell signal.That signal is confirmed by declining beneath its Short-term support and trendline at 161.02.A broken Diagonal trendline implies a complete retracement of the rally.
(Forbes) High-yield bond issuance in 2016, which stands at $228 billion, is likely to fall about 13% short of the total for 2015, to mark a fourth consecutive annual decline. Most forecasts project at least a modest rise in the year ahead, but projections for issuance and high-yield returns cover unusually wide territory, as expected rate volatility dovetails with fiscal uncertainty attendant to the incoming Trump administration.In the year ahead, the Street predicts an uptick in M&A transactions, which naturally could lend well to overall high-yield volume. One particular area of focus expected to be ripe with acquisition activity is the technology, media, and telecom (TMT) sector.
Corporate M&A issuance for 2016 was 12.9% of overall volume, according to LCD, down from 29.82% in 2015.
USB may complete a bounce.

The Long Bond may complete its bounce next week as central banks, pensions and hedge funds continue to perform their quarterly rebalancing. The bounce may go as high as mid-Cycle resistance at 158.55, but the rebalance window may be short and expectations low.The Cycles Model then suggests a resumption of the decline until mid-January after the bounce. The probable target for the final decline appears to be its 35-year trendline at 137.62.
(Reuters) U.S. Treasury debt yields closed lower on Friday in a shortened session, falling for the third straight day to end a weak fourth quarter with a modest consolidation and round out a year of surprises.
Treasury bonds were the worst performing fixed-income asset this year by a wide margin, vastly underperforming both U.S. investment grade and high-yield corporate bonds and federally backed mortgage securities.
Benchmark 10-Year Treasury notes rose 8/32 in price to yield 2.446 percent.
The Euro bounces off its Cycle Bottom.

The Euro bounced off its Cycle Bottom at 103.43 to test the Lip of its inverted Cup with Handle formation.The bounce may not last, as the Euro may not be due for its major low until February. The Cup with Handleallows throw-backs, so we may see a brief visit to Intermediate-term resistance at 108.66.
(Fortune) Europe has not been doing well. Just this year, GDP per capita for the Eurozone as a whole finally returned to pre-crisis levels. It is claiming victory in Spain—even though unemployment remains near 20% and youth unemployment is more than twice that—simply because things are better today than they have been since the euro crisis began a half decade ago. Greece remains in a severe depression. Growth for the Eurozone over the past year has been an anemic 1.6%, and that number is twice the average growth rate from 2005 to 2015. Historians are already speaking of the Eurozone’s lost decade, and it’s possible they’ll soon be writing about its last decade, too.
Euro Stoxx 50 may have completed its right shoulder.

The Euro Stoxx 50 Index remained above its Broadening Flag formation and above its mid-Cycle support at 3222.82, completing the right shoulder of its massive Head & Shoulders formation.The period of strength may have expired and a decline may follow over the next three weeks. The Index must complete a reversal pattern beneath mid-Cycle support/resistance at 3222.82 before a sell signal may be issued.
(Bloomberg) European stocks rose on the last trading day of the year, trimming their first annual decline since the peak of the sovereign-debt crisis in 2011.
The Stoxx Europe 600 Index added 0.3 percent at the close, with trading volume about 60 percent lower than the 30-day average. Real estate firms climbed the most, helping the measure reverse losses of as much as 0.4 percent. The U.K.’s FTSE 100 Index rose 0.3 percent to end the year at a fresh record.
Europe’s benchmark gauge never fully recovered from losses at the start of the year spurred by concern about a slowdown in China. Then came investor concerns about the region’s economy, political uncertainty and Italy’s banking crisis.
The Yen tests the Lip of the Cup with Handle.

The Yen tested, but did not cross the Lip of the Cup with Handle after a test of a possible Master Cycle low on December 15.However, the time for the Cycle turn was early and there may be a retest of the low over the next week.Once complete, the decline sets up a probable “slingshot” move, launching the Yen toward its Cup with Handle target.
(WSJ) The yen is ending 2016 about where it began, but only after some thrills along the way—and a wide range of forecasts suggests next year could offer another roller-coaster ride.
Some 81 outlooks for the end of 2017 put the yen from ¥97 to ¥128 to the dollar, according to data collector Consensus Economics.
In recent trading Thursday, it took ¥117.09 to buy a dollar, near the ¥120 it took at the start of the year. But the yen ended up in the same place by first surging more than 16% against the dollar from January to late June, as concerns about China’s economic growth and the U.K.’s surprise vote to leave the European Union pushed investors into assets considered safe. Also encouraging yen-buying was the idea that the Bank of Japan’s aggressive easing—which had been keeping the currency weak—was running out of steam.
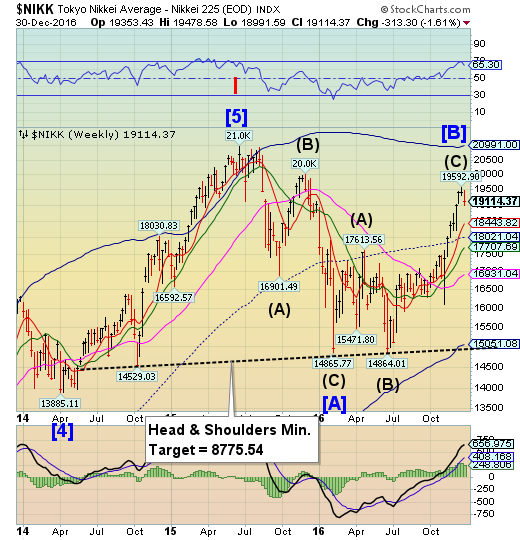
The Nikkei 225 reversed course.

The Nikkei made a substantial reversal after retracing 78% of its decline from the June 2015 high.The rally is very extended, but may offer an aggressive sell signal on the bounce after testing weekly Short-term support at 18443.82
(NikkeiAsianReview) After a wild ride rocked by stunning upsets to the global order, financial markets here sailed into a smooth close, with the Tokyo stock benchmark logging a fifth straight annual gain.
The Nikkei Stock Average slipped 0.16% on Friday to end its final session of 2016 at 19,114 -- a slim 80 points, or 0.42%, above the final close of 2015. This is the smallest year-on-year climb since Japan's Abenomics policies, introduced in November 2012, brought about an uptrend.
U.S. Dollar challenges the trendline.

USD challenged its trendline and Cycle Top support at 101.96, suggesting a new trend may be imminent. A clear decline beneath them may give USD an aggressive sell signal. A further decline beneath Short-term support at 100.78 may change the outlook from bullish to bearish as traders find themselves wrong-footed.
(Reuters) The U.S. dollar slipped on Friday but notched its fourth straight year of gains against a basket of major currencies.
The dollar index DXY, which measures the greenback against a basket of six major rivals, gained about 3.7 percent for the year.
The index rose about 7.1 percent during the fourth quarter, more than half that gain coming since the Nov. 8 U.S. presidential election on expectations that U.S. President-elect Donald Trump's plan to boost fiscal stimulus would benefit the currency. A faster projected pace of rate hikes from the Federal Reserve next year also contributed.
Gold bounces toward the Broadening Top.

Gold began a retracement bounce that may challenge its Intermediate-term resistance at 1237.28. The Cycles Model suggests a probable two-week rally that matches with the Broadening Top pattern and calls for a retracement of one-third to one-half of the decline.
(WSJ) Gold snapped a three-year losing streak with prices rising 8.5% in 2016, but those gains came early while the metal ended the year under a cloud of relentless selling.
Whether rising or falling, gold defied conventional wisdom this year as it frequently moved in the opposite way analysts predicted.
Gold prices soared 16.5% in the first quarter—their largest quarterly gain in three decades, that few saw coming. A stretch of improving U.S. economic data and the strengthening dollar had few analysts expecting gold to rally at the start of 2016.
Crude Oil may have completed its retracement

Crude appears to have concluded a 32.75% retracement of Wave [3].Since then it completed a reversal pattern (daily charts) and may decline to challenge the lower trendline of its Broadening Wedge near 40.00.The Cycles are compressed here, making sudden moves highly probable. Crude may be subject to year-end profit taking/rebalancing.
(Reuters) Hedge funds rushed to place bullish wagers on U.S. crude oil for the fourth week in a row, government data showed on Friday, as prices rallied on expectations that an output cut by top producers would balance the market in the year ahead.
Money managers raised their combined futures and options position in two major NYMEX and ICE markets by 8,494 contracts to 341,834 in the week to Dec. 27, a fresh high since July 2014, U.S. Commodity Futures Trading Commission (CFTC) data showed.
U.S. oil futures on the New York Mercantile Exchange rose about 3 percent and averaged $52.92 per barrel during the five trading days ended Dec. 27.
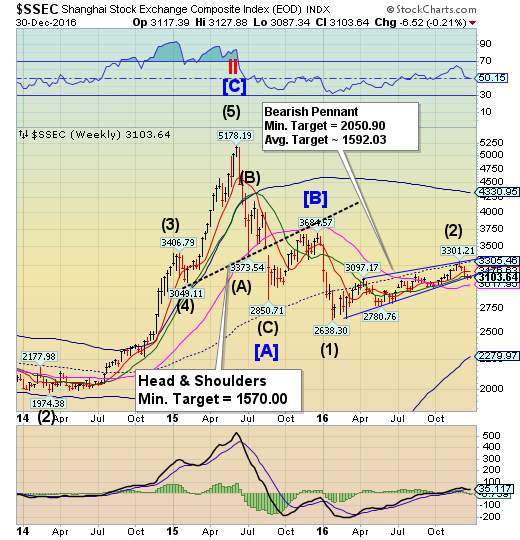
Shanghai Composite Index challenges the Pennant trendline.

The Shanghai Index challenged the lower trendline of its Bearish Pennant formation at 3117.00 and appears to have closed beneath it.A further decline puts the Shanghai on a sell signal.The fractal Model suggests the Shanghai is due for another 1,000 point drop, possibly starting next week. Stay on the alert for an additional breakdown beneath the trendline.
(ZeroHedge) With the topic of Yuan's relentless plunge to all time lows clearly bothering China and threatening to breach the symbolic level of 7 Yuan for the dollar, overnight Beijing decided to do something about it. Only instead of actually implementing much needed, and long overdue economic reforms, banking sector deleveraging or financial liberalization, China once again took the easy way out, when it revised its recently introduced trade-weighted FX currency basket by diluting the role of the dollar and adding another 11 currencies as, in Bloomberg's words, "officials seek to project an image of stability in the yuan."
Alas, "projecting an image of stability" for the dollar may be problematic as explained most recently last night in "With China Facing Currency, Liquidity Crises, Ex-PBOC Official Urges Use Of "Nuclear Option." Even more embarrassing for Beijing is that the Politburo believes it can fool the general public with such cheap dollar-store, no pun intended, gimmicks.
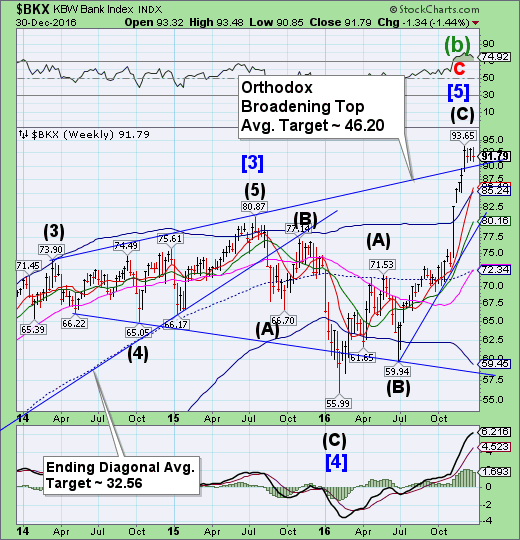
The Banking Index consolidates a third week.

--BKX closed near the low of its consolidation range this week.A reversal beneath the trendline at 90.0 may result in a further decline to the mid-Cycle support at 72.34 under normal circumstances, but the ultimate target may be the “point 6” target near 54.00. Once broken, we may expect this three-year Broadening Top pattern to unwind very quickly.
(Bloomberg) Deutsche Bank AG (DE:DBKGn), UniCreditSpA and eight other European Union banks would fall short of the European Central Bank’s capital demands on Banca Monte deiPaschi di Siena SpA based on stress-test results, highlighting potential objections to the plan.
The ECB told Monte Paschi it needed enough capital to push its common equity Tier 1 ratio to 8 percent of risk-weighted assets in the adverse scenario of the stress test, the Bank of Italy said in a statement late on Dec. 29. That’s well above the legal minimum of 4.5 percent. This year’s health check had no pass mark, but in 2014 lenders were held to a CET1 ratio of 5.5 percent.
(Reuters) Prime Minister Narendra Modi on Friday defended his decision to withdraw high denomination bank notes from circulation, as a deadline to end severe cash shortages passed with Indians still queuing at banks to deposit savings and withdraw money.
Modi abolished 500 and 1,000 rupee bills on Nov. 8, taking out 86 percent of cash in circulation, in a bid to fight corruption, end terror financing and turn India into a cashless society.
The move, however, caused a major cash crunch as the government struggled to replace old notes with new 500 and 2,000 rupee bills. Modi had asked for 50 days, until the end of this month, to ease the crisis.
(Bloomberg) Bank stocks are on a tear after Donald Trump’s victory drove up expectations for the industry’s profits. Here’s the catch for many people working there: Holding onto their jobs won’t be any easier.
While lower taxes, higher interest rates and lighter regulation under Trump could help boost U.S. banks’ earnings by a median 22 percent in 2018, firms will keep chipping away at costs by using technology to replace traders and branches, analysts at Morgan Stanley said this month. And though rising rates may fatten lenders’ profit margins, they can slow demand for new mortgages and corporate debt issuance. Again, that means fewer staff needed.
“It’s hard for me to imagine a job expansion in finance,” said Fred Cannon, head of research at Keefe, Bruyette& Woods. Profits from “higher interest rates will flow to the bottom line without an increase in expenses.”
(ZeroHedge) With the world still napping in a post-Christmas daze, the ECB surprised Italian bank watchers on December 26 when it advised the insolvent, and nationalized, Monte deiPaschi that its capital shortfall had increased by 76% from €5 billion to €8.8 billion as a result of a deposit flight, aka "bank run", that had accelerated and led to a deterioration in the bank's liquidity.
The week before, Monte Paschi admitted, it had already suffered roughly €14 billion in deposit outflows, or 11%, in the first nine months of the year as shown in the chart below.
(ZeroHedge) After two days of total carnage in Toshiba Corp. (T:6502) stocks, bonds, and credit risk, the bloodbath continues with the once-massive Japanese company is collapsing once again in early trading - now down 50% in 3 days. Following the semiconductor and nuclear business catastrophes, the company had nothing to add regarding today's crash but more worryingly the massive loss of market cap is spreading contagiously to Japanese financials with Sumitomo Mitsui Financial (NYSE:SMFG) down 4%, and MUFG down almost 3%.
