Against the backdrop of heat in the United States may increase the demand for electricity for air conditioners
In this review, we suggest to consider the Personal Composite Instrument (PCI) Gas vs Ruble. It reflects the price dynamics of US natural gas versus Russian ruble. Will the – quotations increase ?
Such movement indicates that natural gas in the United States becomes more expensive, and the ruble is weakened. The Bank of Russia lowered its key rate at a meeting on June 14, 2019 to 7.5% from 7.75%. At the same time, inflation in Russia is 5.1%, which is significantly higher than the target level of the Central Bank of the Russian Federation (4%). The Russian regulator reduces the rate in order to maintain very weak economic growth and prevent capital outflow. Against the background of relatively high inflation and actual stagnation in the economy, this may adversely affect the ruble exchange rate. In turn, the possible growth of quotations of natural gas in the United States can contribute to an increase in demand for electricity for air conditioners during the hot weather in the United States. The agency Refinitiv predicts an increase in gas consumption in the US next week to 87.2 billion cubic feet per day compared to 83.4 billion this week. Another factor in favor of the growth of quotations could be an increase in the capacity of terminals for the export of American liquefied natural gas from the current level of 5.7 billion cubic feet per day to 7.4 million by the end of 2019 and to 10 million by 2020. At the same time, U.S. Energy Information Administration does not expect further significant growth in US gas production. According to its forecast, on average for the entire current year it will be 90.6 billion cubic feet per day. Whereas production this week has already reached 89.9 billion.

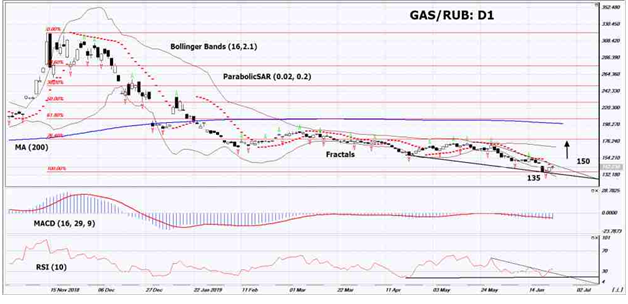
On the daily timeframe GAS/RUB: D1 moved closer to the resistance line of the downtrend. It must be punched up before opening a buy position. Various technical analysis indicators have generated upside signals. Further growth of quotations is possible if the demand for gas in the United States increases and the Russian ruble weakens.
- The Parabolic indicator indicates downtrend signal. It can be used as an additional resistance level that must be overcome before opening a buy position.
- The Bolinger bands widened, indicating high volatility.
- The RSI indicator is below 50. It has formed a divergence to increase.
- The MACD indicator shows a weak uptrend signal.
The bullish momentum may develop in case if GAS/RUB exceeds the Parabolic signal, close the price gap on the daily chart and overcome the resistance trend line of the downward trend: 150. This level may serve as an entry point. The initial stop loss may be placed lower than the last lower fractal and the minimum since April 2016: 135. After opening the pending order, we shall move the stop to the next fractal low following the Bollinger and Parabolic signals. Thus, we are changing the potential profit/loss to the breakeven point. More risk-averse traders may switch to the 4-hour chart after the trade and place a stop loss moving it in the direction of the trade. If the price meets the stop level (135) without reaching the order (150), we recommend to cancel the order: the market sustains internal changes that were not taken into account.
Technical Analysis Summary
| Position | Buy |
| Buy stop | Above 150 |
| Stop loss | Below 135 |
Market Overview
US stocks fall after Powell’s ‘wait-and-see’ comment
Dollar strengthens after Fed signals rate cut not a certainty US stock market extended losses on Tuesday after weak data and comment by Fed chair the central bank was still in ‘wait-and-see’ mode on potential rate cuts. The S&P 500 lost 1% to 2917. Dow Jones industrial slid 0.7% to 26548. The Nasdaq dropped 1.5% to 7885. The dollar weakening reversed as St. Louis Fed President James Bullard said he was not in favor of a “huge action” on rates in July despite as 7.8% drop in home sales in May versus April: the live dollar index data show the ICE (NYSE:ICE) US Dollar index, a measure of the dollar’s strength against a basket of six rival currencies, rose 0.2% to 96.16 and is higher currently. Futures on US stock indices point to higher openings today.
FTSE 100 gained while other European indexes slid
European stocks slid further on Tuesday led by auto maker shares. The EUR/USD joined GBP/USD s continuing slide with both pairs lower currently. The Stoxx Europe 600 ended marginally lower as the EU indicated that the Italian government may have anywhere between three and six months to take steps toward reducing the country’s budget deficit. The German DAX 30 fell 0.4% to 12228.44. France’s CAC 40 slipped 0.1%. UK’s FTSE 100 however added 0.1% to 7422.43 despite Boris Johnson’s reiterating of his threat to take the UK out of the European Union in October with or without agreeing a deal with the bloc.

Hang Seng still gains while other Asian indexes fall
Asian stock indices are mostly lower today as as administration official said Washington will not accept any conditions on tariffs at President Trump’s meeting with Chinese President Xo Jinping at the G20 summit in Japan.Nikkei fell 0.5% to 21086.59 despite yen’s slide against the dollar. Chinese stocks are mixed: the Shanghai Composite Index is down 0.2% while Hong Kong’s Hang Seng index is 0.2% higher. Australia’s All Ordinaries Index extended losses 0.3% with Australian dollar resuming its climb against the greenback.
Brent up
Brent futures prices are edging higher today. The American Petroleum Institute late Tuesday report indicated US crude inventories fell by 7.5 million barrels last week. Prices rose yesterday: August Brent ended up 0.3% at $65.05 a barrel on Tuesday. Today at 16:30 CET the Energy Information Administration will release US Crude Oil Inventories.
