Technical Analysis
Alibaba Group Holdings (NYSE:BABA) sales growth has decelerated while it beat 2018 fourth quarter sales forecast. Will the Alibaba price continue declining?
Alibaba Group beat fourth-quarter revenue forecasts two weeks ago: revenue increased 51% for January-March from a year earlier to 93.50 billion yuan ($13.6 billion). Alibaba forecast its revenue for the full fiscal year ending in March 2020 will record a 33% increase on the previous year. However Alibaba’s top-line growth rates have slowed sharply from a few years ago. Core commerce segment accounts for 86% of BABA’s revenue. In the past couple of years, core e-commerce revenue growth has decelerated from 55-54% over year in the first quarter of 2018 financial year to 28% in 2019. The sales growth slowing is happening while most of Alibaba’s new initiatives are still losing money. Slowing revenue growth is bearish for Alibaba's stock price
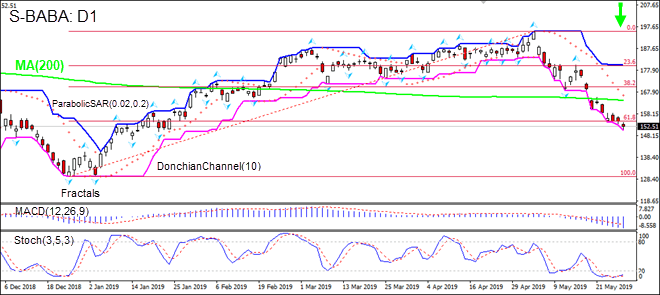
On the daily timeframe the S-BABA: D1 has breached below the 200-day moving average MA(200) and Fibonacci 61.8. This is bearish.
-
The Parabolic indicator gives a sell signal.
-
The Donchian channel indicates downtrend: it is tilted lower.
-
The MACD indicator gives a bearish signal: it is below the signal line and the gap is widening.
-
The Stochastic oscillator is in the oversold zone. this is bullish.
We believe the bearish momentum will continue after the price breaches below the lower boundary of Donchian channel at 150.68. This level can be used as an entry point for placing a pending order to sell. The stop loss can be placed above the fractal high at 180.19. After placing the order, the stop loss is to be moved every day to the next fractal high, following Parabolic signals. Thus, we are changing the expected profit/loss ratio to the breakeven point. If the price meets the stop loss level (180.19) without reaching the order (150.68), we recommend cancelling the order: the market has undergone internal changes which were not taken into account.
Technical Summary
- Position Sell
- Sell stop Below 150.68
- Stop loss Above 180.19
Market Overview
- US stocks lower as yield curve inversion deepens
- Dollar strengthened despite bond yields decline
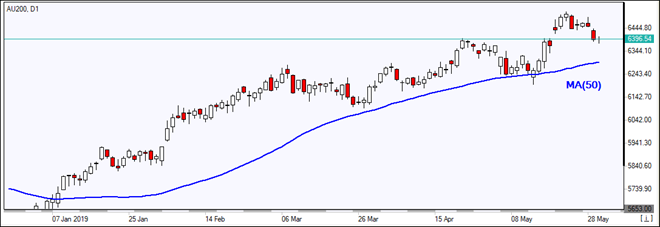
US stock market extended losses on Wednesday as the spread between the 10-year Treasury note and the 3-month Treasury bill moved further into negative territory. The S&P 500 lost 0.7% to 2783.02. The Dow Jones Industrial Average dropped 0.9% to 25126.41. NASDAQ Composite index fell 0.8% to 7547.31. The dollar strengthening continued at previous session pace: the live dollar index data show the US Dollar index, a measure of the dollar’s strength against a basket of six rival currencies, added 0.2% to 98.12 and is higher currently. Futures on US stock indices point to higher openings today.
CAC 40 Underperforms European Indexes
European stocks slide accelerated on Wednesday on persisting political tension over budget standoff between Italy and the EU. Both the EUR/USD and GBP/USD kept sliding and are lower currently. The STOXX 600 dropped 1.5% led by basic resources. Germany’s DAX 30 fell 1.6% to 11897.91. France’s CAC 40 sank 1.7% while UK’s FTSE 100 lost 1.2% to 7185.30.
Australia’s All Ordinaries Leads Asian Losses
Asian stock indices are falling today. Nikkei slid 0.3% to 20942.53 despite continuing yen slide against the dollar. Chinese stocks are falling after Tuesday comments by Chinese official that Beijing could use its strength in rare earth minerals as leverage in its trade dispute with the US: the Shanghai Composite Index is down 0.8% and Hong Kong’s Hang Seng Index is 0.8% lower. Australia’s All Ordinaries Index lost 0.9% as Australian dollar turned higher against the greenback.
Brent Gains On US Crude Inventories
Brent futures prices are edging higher today. Prices fell yesterday. The American Petroleum Institute reported late Wednesday US crude inventories fell by 5.3 million barrels last week. July Brent crude lost 0.9% to $69.45 a barrel on Wednesday. Today at 16:30 CET the Energy Information Administration will release US Crude Oil Inventories.


