Both SPX and NDX closed beneath their Long-term supports, suggesting a probable change of trend may be developing. While many investors have begun to recognize this, most have done nothing about it. It’s time for a showdown. Either the bulls get back in the saddle or leave town.
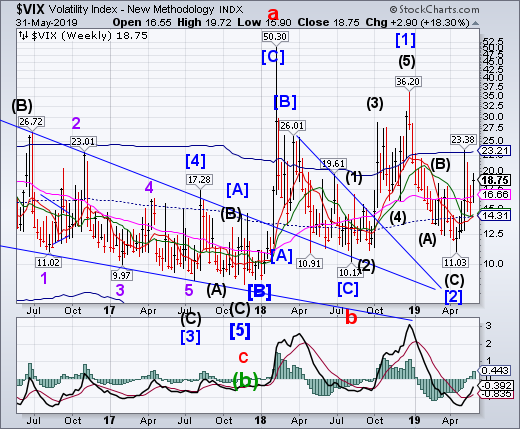
VIX rose above Long-term resistance at 16.66, closing above it this week. The Cycles Model suggests Cyclical strength may dominate through the first week of June. There is a strong likelihood that VIX may rally to the December high as a minimum.
(Bloomberg) If euphoria was the concern, you can stop worrying.
With books now closed, the S&P 500 has formally delivered its worst May return in seven years and second-worst since the 1960s, falling 6.6%. For tech traders watching the Nasdaq 100, the experience was only a shade less harrowing than the crash months of October and December.
Peace has been shattered, and for now, those voices calling for a 1990s-style melt-up have gone silent. As the U.S.-China trade spat escalates further and Donald Trump threatens higher tariffs on Mexican goods, this month’s $4 trillion global plunge is making dip-buying perilous.
SPX Breaks Long-Term Support
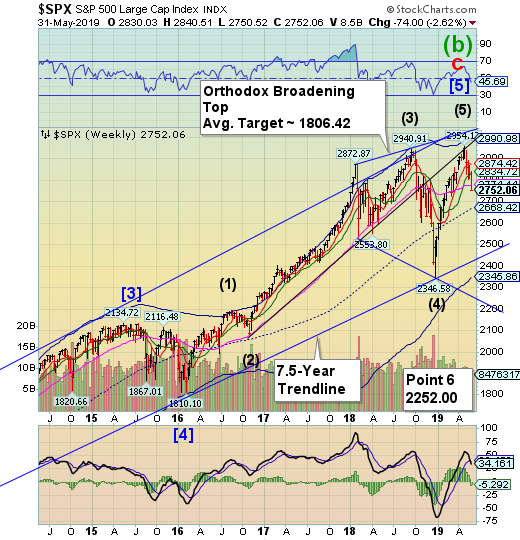
SPX plunged through Long-term support at 2774.44, closing beneath it. May’s total loss in the SPX was nearly 7%. Dip-buying in the month of May has not been profitable. A sell signal has been in effect beneath Short-term support at 2874.42. “Point 6” lies beneath the December 26 low.
(CNBC) Stocks fell on Friday as investors feared President Donald Trump’s surprise threat of tariffs on all Mexico imports, amid a worsening trade war with China, could risk sending the U.S. economy into a recession.
The Dow Jones Industrial Average closed 354.84 points lower at 24,815.04, while the S&P 500 slid 1.3% to 2,752.06. The Nasdaq Composite dropped 1.5% 7,453.15. The S&P 500 ended the month down 6.6% as volatility spiked after trade talks fell apart with China and rhetoric on both sides worsened in May.
NDX Also Breaks Long-Term Support
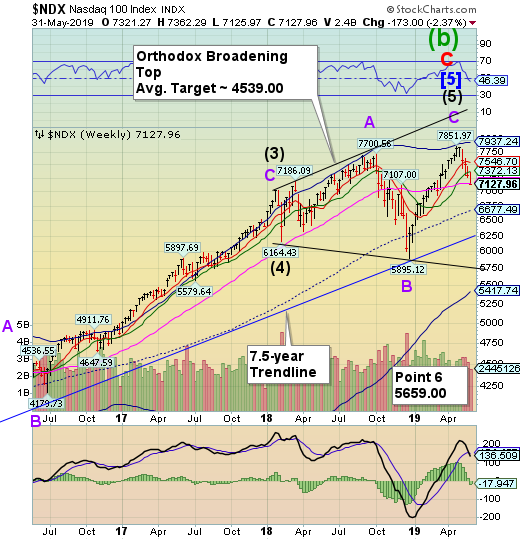
NDX declined over 9% in the month of May, closing beneath its Long-term support at 7145.02. The Orthodox Broadening Top appears to be the primary formation in play. Cyclical strength indeed ran out as expected and may continue through mid-July.
(Bloomberg) The S&P 500’s worst week since Christmas makes a grim finale to a May that put a four-month market rally to a halt.
Some $1.7 trillion was yanked from the S&P 500 this month as 10 out of 11 industry groups retreated. It was particularly bad for tech, the index’s biggest sector, which plunged 8.9% in the worst month since 2008. That translated into a $515 billion drop in market capitalization. Energy stocks, whose market cap is a fraction of tech’s, fell 11.7%, which amounted to a $152 market cap decline.
Between a trade war that now spread out to Mexico, a breakdown in U.S.-China negotiations and a rising concern about growth, that’s of little surprise. The only sector that survived the selloff unscathed was real estate, which gained 0.9% for the month.
High Yield Bond Index Plunges Through Long-Term Support
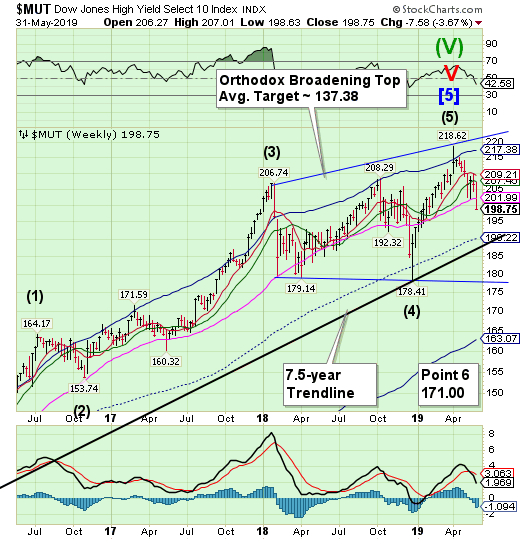
The High Yield Bond Index plunged through Long-tern Support at 201.99, closing the week beneath it. A sell signal has been confirmed. Point 6 may be the Cycle Bottom at 163.07. The Cycles Model warns the decline may have legs.
(DollarCollapse) One of the lessons of the past few decades’ boom/bust cycles is that each financial bubble emerges in a different asset class. In the 1970s it was precious metals, in the 1980s junk bonds, in the 1990s tech stocks and in the 2000s mortgage-backed bonds.
Today the only one of these with a reasonable chance of blowing up the economy is Big Tech, which is wildly overvalued by any historical measure.
But a better candidate for the title of most dangerous bubble is emerging: Corporate debt, specifically the “almost junk” portion of that market.
Treasuries Make 20-Month High
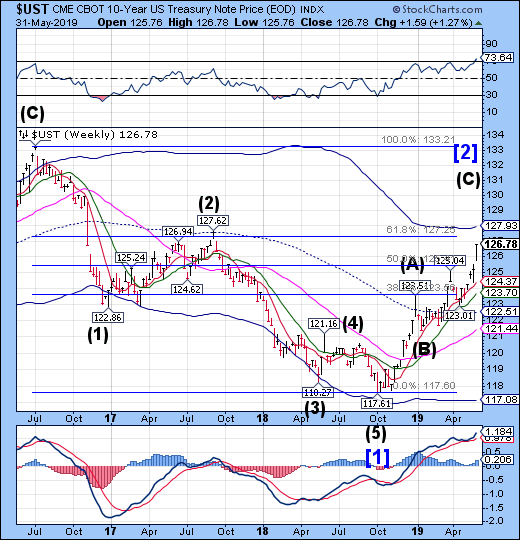
The 10-year Treasury Note Index rallied to a level not seen since September 2017. It remains on a buy signal with a potential target at the Cycle Top resistance at 127.93. The Cycles Model suggests the rally may continue through mid-June.
(ZeroHedge) The legendary creator of the MOVE bond volatility index and the iconic Merrill Lynch RateLab, Harley Bassman, has opined on the biggest inversion in the yield curve since the financial crisis (3M-10Y dipped as low as -22.5bps this morning), and his view is hardly favorable.
As Bassman notes in his latest note “Can you hear me Knocking”, he reminds his readers that in his February 6, 2019 commentary titled “Wall Street Jenga”, he noted that “December’s initial Yield Curve inversion flashed a signal for a market or economic disruption in Q2-2020 (Eighteen months ahead).” Fast forward to today when he cautions that “this week, these two rates finally inverted.” And in response to those “best and brightest who are bleating how “it is different this time”, Bassman has a one-word answer: “Puff!”
The Euro Trend Is On A Groundhog Day Loop
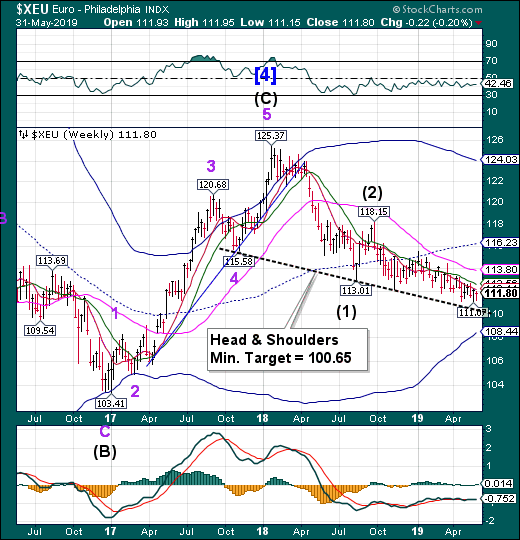
The euro consolidated after last week’s low, but could not rise above weekly Short-term resistance at 112.00. The Cycles Model suggests that it may be due for a minor bounce, but there appears to be no strength in the current Cycle. Cyclical strength does not reappear until the end of June.
(Reuters) – The Netherlands on Friday became the latest euro zone state to see its 10-year yields fall below zero percent, joining a pool of negative-yielding euro government bonds that grew in May to encompass 48% of the euro debt traded on Tradeweb.
This proportion, the latest sign of the pessimism gripping world markets, is the highest since September 2016, according to data from Tradeweb.
Bond yields across major developed markets have plunged this year as weak data, trade tensions and a dovish policy shift from major central banks boost demand for fixed income.
Euro Stoxx Consolidates Above Intermediate-Term Support
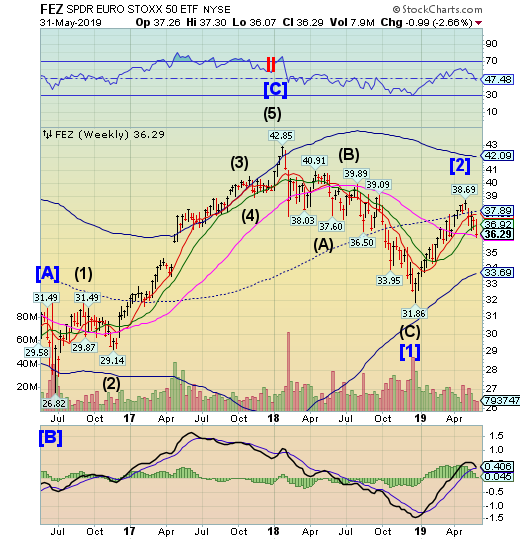
Note: StockCharts.com is not displaying the Euro Stoxx 50 Index at this time.
The Euro Stoxx 50 SPDR plunged through Intermediate-term support at 36.92, challenging Long-term support at 36.13, closing above it. It is on a sell signal beneath Short-term resistance at 37.89. The Cycles Model suggests up to 6 weeks of decline may lie ahead.
(Reuters) – European stocks tanked on Friday, with auto-makers hit especially hard, after U.S. President Donald Trump widened the scope of his trade wars by threatening to impose new tariffs on Mexican imports.
Investors exited riskier equity positions and moved to safer ground, sending European defensive stocks higher and yields on German bonds to record lows.
The pan-Europe STOXX 600 fell 0.8% on the day to close out May with a 5.7% slide, its worst monthly loss since January 2016.
The Yen Gets A Second Wind
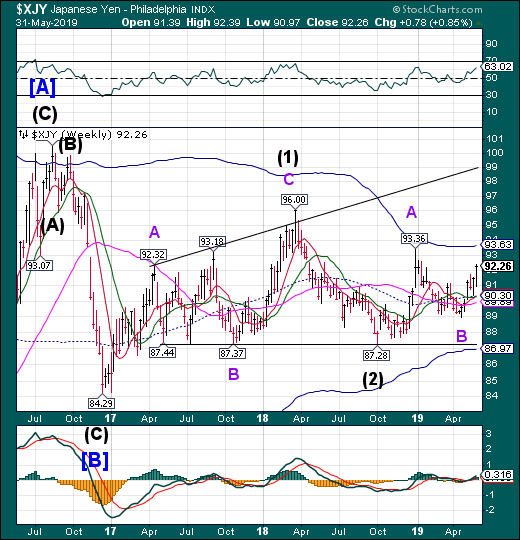
The yen broke higher this week as investors fled to safe havens. The Cycles Model usually calls for a pullback at this point, but instead shows strength through mid-June before any consolidation. It may meet or exceed the Cycle Top resistance at 93.63 in the next two weeks
(Reuters) – Investors rushed into the perceived safety of the Japanese yen on Friday, with the currency scoring its best day against the dollar in four months, after U.S. President Donald Trump’s threat to impose tariffs on Mexico roiled financial markets and stoked recession fears.
Taking aim at what he said was a surge of illegal immigrants across the southern border, Trump vowed on Thursday to impose a tariff on all goods coming from Mexico, starting at 5% and ratcheting higher until the flow of people ceases.
Nikkei Plunges Through Head & Shoulders Neckline
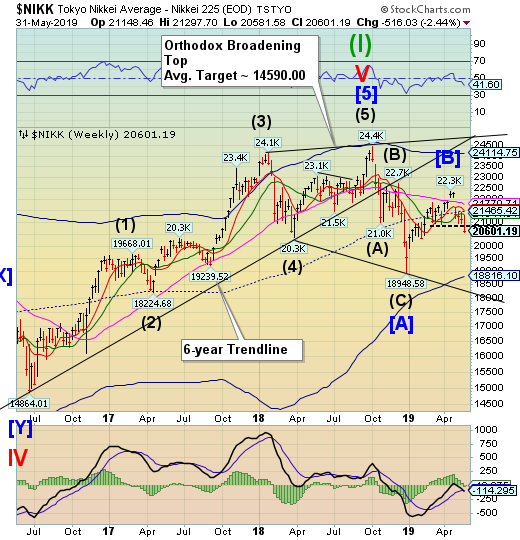
The Nikkei Index plunged through a small Head & Shoulders neckline at 20900.00 that threatens to bring the Nikkei below 20000.00. The island reversal stands and implies a strong sell signal. The support line at 20900.00 could not withstand the decline. While there may be a small bounce early next week, the trend is now down for the next 6 weeks.
(JapanTimes) The benchmark Nikkei average closed below 21,000 for the first time in more than two months on the Tokyo Stock Exchange on Thursday, with investor sentiment hurt by falls in overseas equities amid simmering U.S.-China trade tensions.
The 225-issue Nikkei average fell 60.84 points, or 0.29 percent, to end at 20,942.53, its first finish below the psychologically important line since March 25. Wednesday, the key market gauge lost 256.77 points.
The Topix index of all first section issues closed down 4.43 points, or 0.29 percent, at 1,531.98, after shedding 14.58 points the previous day.
U.S. Dollar Consolidates
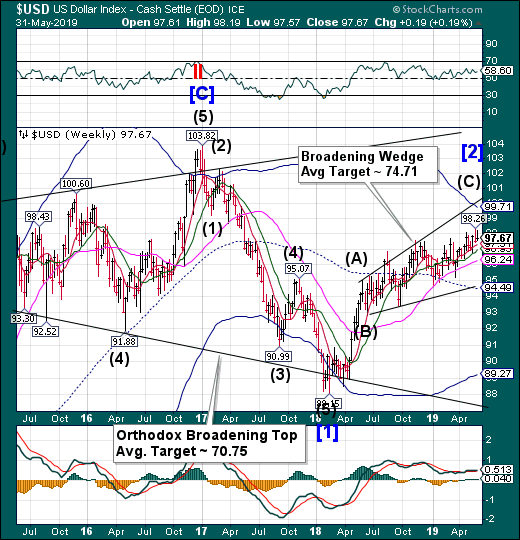
USD consolidated this week, closing above weekly Short-term support at 97.31. It appears that Dollar weakness may surprise investors over the next two weeks.
(TheStreet) The U.S. Dollar Index has been firm since early 2018, climbing from below 89 to recently above 98. We decided to take a look at the index to see if a turn to the downside could be coming.
With the price of gold firming, if we see the U.S. Dollar index weaken now, gold could rally even stronger in the next few weeks. Let’s check.
In the daily bar chart of DXY (the symbol for the U.S. Dollar Index), below, we can see an uptrend the past twelve months but with frequent pullbacks and corrections. DXY is above the rising 50-day moving average line and the bullish or rising 200-day line.
We can see that the 50-day line was tested in April and May and will probably be challenged in June. The 200-day line was tested in January and March.
Gold Rallies Back Above 1300.00
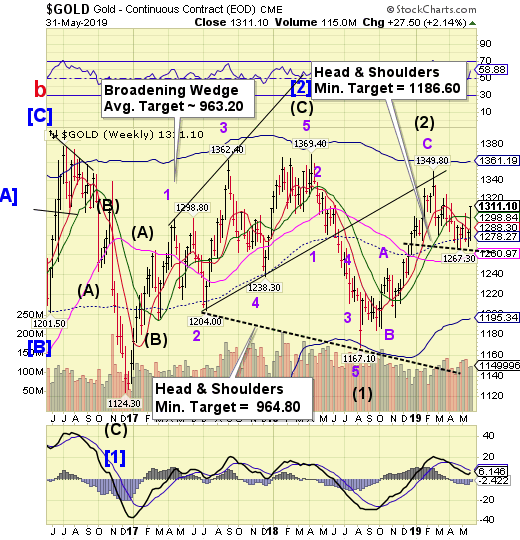
Gold continued its bounce above the Head & Shoulders neckline at 1267.36 and rallied above 1300.00 on the Trump tariff announcement on Thursday night. While this action threatens the sell signal it does not yet indicate a change of trend. The neckline of the Head & Shoulders formation reinforces the sell signal when broken.
(Investing.com) – What fears over China couldn’t achieve, worries over Mexico have done.
Bullion and futures of gold returned to the key bullish $1,300 mark on Friday as equity markets cratered and benchmark U.S. Treasury yields tumbled after President Donald Trump’s move to add Mexico to the U.S. list of trade adversaries.
Spot gold, reflective of trades in bullion, traded at $1,304.81 per ounce by 2:35 PM ET (18:35 GMT), up $16.34, or 1.3%. It hit a seven-week high of $1,307.02 earlier. For the whole of May, spot gold was up 1.7%.
Crude Takes A Deep Plunge
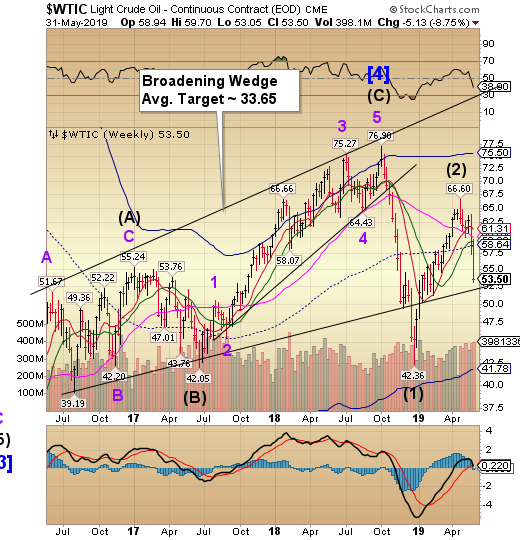
After having lost all supports, Crude plunged to its lowest point since February. Crude remains on a sell signal. The ensuing decline may last another 2-3 weeks. This may be the big one.
(FoxBusiness) Oil prices slumped to a three-month low Friday as concerns about President Trump’s trade policy . and the slowdown in the Chinese economy . cast doubt on the outlook for global demand.
Front-month Brent crude futures, the international benchmark, traded down 2.6% at $63.60, having earlier dipped to their lowest level since mid-February. U.S. benchmark WTI dropped 2.4% to $55.25, its cheapest price since early March.
The steep declines came alongside a broad retreat in riskier assets after President Trump announced a plan to impose escalating tariffs on Mexican imports starting June 10. The U.S. is a major importer of Mexican crude, and refineries relying on the supply could face difficulties replacing it once tariffs are imposed.
Agriculture Prices Rally To Long-Term Resistance
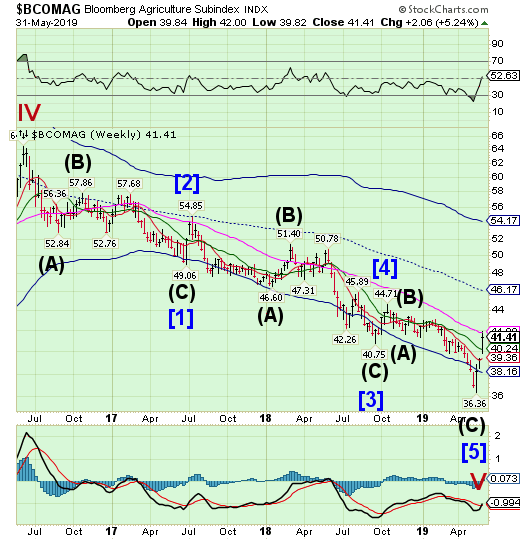
The Bloomberg Agricultural Subindex continues to rally from its 34.4-month low. This week it challenged Long-term resistance at 41.80, closing beneath it. This index is now on a buy signal. A preliminary estimate puts the initial rally up to the mid-Cycle resistance at 46.17.
(EconomicCollapse) All across America, U.S. farmland is being gobbled up by foreign interests. So when we refer to “the heartland of America”, the truth is that vast stretches of that “heartland” is now owned by foreigners, and most Americans have no idea that this is happening. These days, a lot of people are warning about the “globalization” of the world economy, but in reality our own soil is rapidly being “globalized”. When farms are locally owned, the revenue that those farms take in tends to stay in local communities. But with foreign-owned farms there is no guarantee that will happen. And while there is plenty of food to go around this is not a major concern, but what happens when a food crisis erupts and these foreign-owned farms just keep sending their produce out of the country? There are some very serious national security concerns here, and they really aren’t being addressed. Instead, the amount of farmland owned by foreigners just continues to increase with each passing year.
Prior to seeing the headline to this article, how much U.S. farmland would you have guessed that foreigners now own?
Shanghai Index Consolidates Above Support
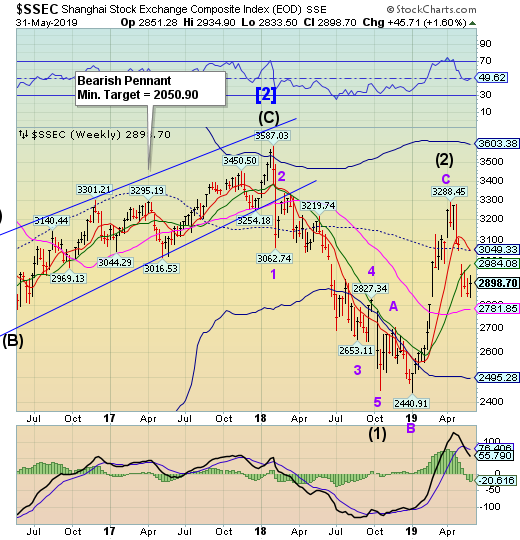
The Shanghai Index continues to consolidate above Cycle support at 2838.00. The consolidation continues until the support gives way. The Cycles Model suggests that, after a possible brief period of strength next week, the decline may resume through the end of June.
(ZeroHedge) China’s Official May Composite PMI printed modestly lower than April’s at 53.3, with Services at 54.3 (in line with last month and goal-seeked expectations), while Manufacturing (expected to decline into contraction at 49.9) was considerably worse than expected, printing 49.4.
This was below the lowest analyst estimate of 49.5, and close to the lowest level in about a decade.
Under the hood of the manufacturing data, Output growth slowed, New Orders tumbled into contraction (with export orders plunging), inventories rose, employment slipped, and input & output prices contracted. The most affected were Small Enterprises.
The Banking Index Decline Picks Up Momentum
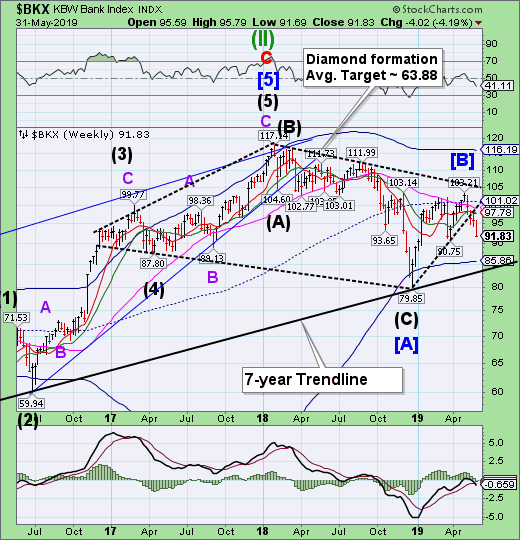
— BKX ramped up the decline in the second week after breaking through the Diamond formation. The Cycles Model suggests the trend is down for the next 5-6 weeks. This may be ample time to meet the Broadening Wedge target.
(ZeroHedge) Yesterday we reported that in the aftermath of the failure of China’s Baoshang Bank (BSB), and its subsequent seizure by the government – the first takeover of a commercial bank since the Hainan Development Bank 20 years ago – the PBOC appeared to panic and injected a whopping 250 billion yuan via an open-market operation, the largest since January.
And while the bank first failure of a Chinese bank resulted in some notable turmoil in China’s interbank market, where the issuance of Negotiable Certificates of Deposit was partially frozen as overnight funding rates spiked, dragging prices of both corporate and sovereign bonds briefly lower, we warned that “Baoshang is just the tip of the iceberg.”
According to UBS analyst Jason Bedford, who in 2017 was the first to highlight Baoshang’s troubles, there are several other banks that have “identical leading risk indicators” to Baoshang. Hengfeng Bank, Jinzhou Bank Co. and Chengdu Rural Commercial Bank all failed to publish their latest financial statements, have a large portion of their balance sheets invested in “loan-like investment assets” and are subject to negative local media coverage.
(WaPo) Federal Reserve Chair Jerome Powell gave a speech a couple of weeks back that showed that financial regulators have learned many lessons from the 2008 financial crisis, but not the most important one, namely:
If regulators wait to act until they can say with certainty that a credit bubble is about to burst, they’ve waited too long.
That’s particularly true when it comes to the opaque and unregulated “shadow” banking system on Wall Street that has now supplanted regulated banks as the leading source of credit for businesses and consumers. This shadow system gets its money from big investors rather than depositors, and it revolves around hedge funds, investment banks and private equity funds rather than banks. These shadow banks have made borrowed money cheaper and easier to get, but they have also made the financial system and the U.S. economy more susceptible to booms and busts. And with another giant credit bubble ready to burst — this one having to do with business borrowing — we’re about to learn that painful lesson again.
(Bloomberg) Deutsche Bank AG (DE:DBKGn) and UBS Group AG briefly explored the idea of a megamerger earlier this year that would have created continental Europe’s biggest financial institution, people with knowledge of the matter said.
Top Deutsche Bank and UBS officials held preliminary discussions in recent months about a potential combination, according to the people, who asked not to be identified because the information is private. The talks, which never proceeded beyond the initial stage, grew out of now-stalled negotiations to combine the firms’ asset management businesses, the people said.
The move underscores the wide range of options Deutsche Bank has been willing to explore as Chief Executive Officer Christian Sewing hunts for a new strategy to present to investors. There may be regulatory support for tie-ups amid increased U.S. competition: European Central Bank President Mario Draghi said in April that Europe’s banking system is overcrowded and “the need for consolidation is very significant.”
Disclaimer: Nothing in this email should be construed as a personal recommendation to buy, hold or sell short any security. The Practical Investor, LLC (TPI) may provide a status report of certain indexes or their proxies using a proprietary model. At no time shall a reader be justified in inferring that personal investment advice is intended. Investing carries certain risks of losses and leveraged products and futures may be especially volatile. Information provided by TPI is expressed in good faith, but is not guaranteed. A perfect market service does not exist. Long-term success in the market demands recognition that error and uncertainty are a part of any effort to assess the probable outcome of any given investment. Please consult your financial advisor to explain all risks before making any investment decision. It is not possible to invest in any index.
