-
Dollar hits 14-week high
-
Investor rotation into bonds creates resistance at 3 percent level, pressuring stocks
-
Policy easing halts Chinese stock decline
-
Google falls despite strong earnings beat
-
Semiconductors drag tech sector lower
-
Aluminum bucks commodity rally on potential US policy shift
-
Oil climbs back above $69
-
US GDP and jobless claims are due later this week.
-
Earnings season continues. Among those reporting: Amazon (NASDAQ:AMZN), Samsung (OTC:SSNLF) and Credit Suisse Group (NYSE:CS).
-
The European Central Bank decides on interest rates on Thursday. Investors will watch for any sign that policymakers are preparing to taper stimulus at June meeting.
-
Bank of Japan announces its latest policy decision on Friday and releases a quarterly outlook report.
- The Stoxx Europe 600 Index declined 0.1 percent, the largest drop in more than a week.
- Futures on the S&P 500 Index advanced 0.1 percent, the biggest gain in a week.
- The MSCI All-Country World Equity Index climbed less than 0.05 percent.
- The U.K.’s FTSE 100 advanced 0.1 percent, reaching its highest point in more than 11 weeks on its sixth consecutive advance.
- Germany’s DAX increased less than 0.05 percent.
- The MSCI Emerging Market Index fell 0.1 percent to the lowest in almost three
-
The Dollar Index climbed 0.15 percent, reaching the highest in more than 14 weeks on its sixth straight advance.
-
The euro dipped less than 0.05 percent to $1.2205, the weakest in almost eight weeks.
-
The British pound declined 0.1 percent to $1.3924, reaching the weakest level in six weeks on its sixth consecutive decline.
-
The Japanese yen fell 0.1 percent to 108.87 per dollar, hitting the weakest level in almost 11 weeks with its fifth straight decline.
-
The yield on 10-year Treasuries sank one basis point to 2.96 percent, the first retreat in more than a week and the biggest loss in almost two weeks.
-
Germany’s 10-year yield sank two basis points to 0.62 percent, the largest tumble in more than two weeks.
-
Britain’s 10-year yield declined three basis points to 1.539 percent.
Key Events
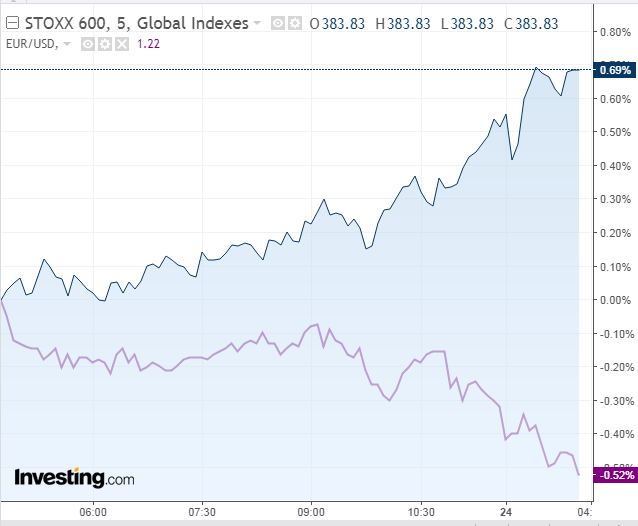
Following a rally during the Asian session, European equities bounced back from an initial dip in the first ten minutes of trade this morning. US futures, including the S&P 500, the Dow and the NASDAQ 100 started to fall around an hour earlier, but then reversed course and joined the European rebound. At time of writing, however Dow futures are once again slipping
There is no specific fundamental driver for this move higher, other than the price of the euro. During the time stocks were slipping, the euro was strengthening—once the euro started falling, stocks began climbing.
This underscores the impact a currency can have on the assets it denominates, clearly illustrated in the chart above showing the diverging directions of the EURUSD pair versus the STOXX 600 Index. The dampening effect of the rising US dollar on US shares is another case in point.
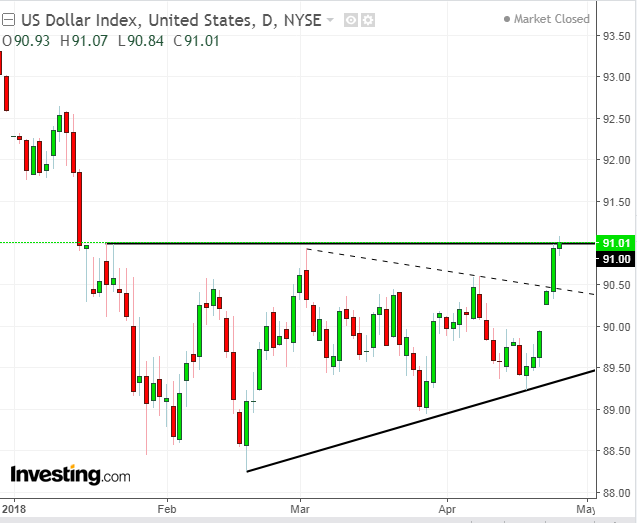
The Dollar Index advanced for a sixth straight day on Monday, closing at its highest level since January 16. After completing a possible symmetrical triangle—a pattern that projects the equal determination of bulls and bears and therefore implies uncertain outcomes—the USD price is on the verge of completing an ascending triangle, which would indicate that bulls are gaining, making it an innately bullish pattern.
The greenback got a boost from 10-year Treasury yields hitting the 2.99 percent mark, a rate not seen since the first trading session of 2014. Higher rates attract investor demand, making them happy to bag a relatively good ROI as well as the security of the world's most stable sovereign.
Higher yields, boosted by mounting commodity prices, are the key driver of the current market mechanism. Investor concerns over rising inflation and its possible effect on the economy compound the sell off. This in turn pushed yields to a multi-year high that looked very attractive to nervous investors, whose money has been stuck in overpriced stocks exposed to multiple global and domestic headwinds.
Yields crossing 2.98 created resistance to the 3.00 percent psychological level, adding pressure on stock prices. However, The damage may have already been done. A new peak has posted, extending the uptrend. This renders the current decline nothing more than a natural correction within a presumed continued yield rally, or a selloff for their underlying bonds.
This also explains both the equity selloff and the US dollar spike. Investors are rotating out of risk-burdened, overvalued stocks and buying the global reserve currency in order to rotate into dollar-denominated bonds.
Global Financial Affairs
Among the major global currencies, first and foremost the safe haven yen has taken a hit from the stronger USD. The USD/JPY pair fell 1.05 percent, which comes as further evidence of the sheer bullishness of the greenback if one considers the market's current risk-off mood.
The weakening yen propelled Japanese stocks on the TOPIX to their highest level in nearly two months. Chinese equities on the Shanghai Composite outperformed, finally arresting weeks of trade jitters-driven underperformance. The rebound was helped by signs that Xi Jinping's government is moving to ease some of the measures it had originally enacted in order t to clamp down on a credit binge in some parts of the country's economy.
The Hang Seng was also boosted by United Company Rusal (HK:0486), which leaped more than 30 percent after the US Treasury Department eased sanctions against the Russian aluminum producer, and said it will consider lifting sanctions altogether if the company's largest shareholder—Oleg Deripaska—cedes control of the company. Meanwhile, South Korea's KOSPI edged lower after memory chip supplier SK Hynix (KS:000660) joined the club of chipmakers that missed earnings expectations.
The string of disappointing results from semiconductor manufacturers has pushed the Philadelphia Semiconductor Index lower by more than 7 percent in just four days, spurring doubts over the growth outlook for smartphones producers. This has added a considerable headwind to the broader technology sector.
On Monday, US equities were whipsawed by repeated wild swings. After oscillating between gains and losses, the S&P 500 ended the day barely in the green (+0.1 percent), saved by a 0.59 percent Energy sector gain.
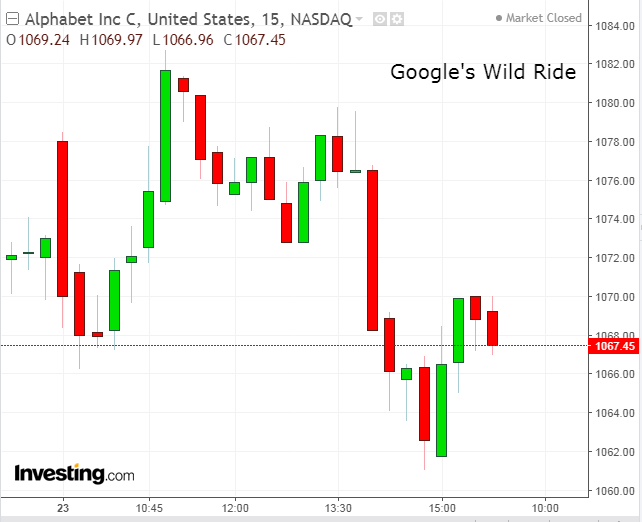
Even though Alphabet (NASDAQ:GOOG) beat expectations, coming in at $9.93 EPS vs an $9.28 expected, with revenues at $31.15 billion against $30.29 billion eyed, with $7 billion in operating income against expectations of $6.6 billion in 2017, Technology shares were still the biggest drag on the benchmark index. The sector was down 0.36 percent.
Google's top and bottom line beats didn't help tame the market fluctuations. The stock initially bounced 3 percent but later suffered hefty swings and closed 0.45 percent lower.
Oil climbed back above $69 a barrel, while aluminum slipped out of the commodity rally, extending its largest drop since 2005.
Up Ahead
Market Moves
Stocks
Currencies
Bonds
Commodities


