Thursday January 26: Five things the markets are talking about
Markets are responding positively to Trump’s presidency following some disappointment in the immediate aftermath of his inauguration speech. The question is, will the USD follow suit and resume its appreciation?
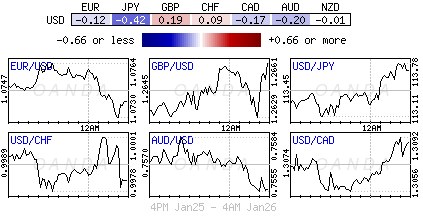
With treasury yields and equities playing the reflation trade, the ‘mighty’ dollar has become somewhat of an island at the moment.
Currently, investors remain somewhat wary of the impact of U.S. trade policies on the ‘buck’ and what Washington’s approach to dollar policy will be. If the post U.S. election correlations hold, the USD should be higher.
How much more can the USD go down? For the dollar ‘bulls’ that have bought into the Trump ‘reflation’ trade it’s now becoming an extraordinary expensive position, especially after Treasury secretary nominee Mnuchin's comments that the buck was too strong last week. Only time will tell whether the weak ‘bull’s’ will be forced to capitulate, for now, they have too much skin in the game to bail.
1. Global stocks follow the Dow’s lead
The global equities rally continues to gather speed as investors embrace riskier assets after the Dow Jones Industrial Average topped 20,000 for the first time yesterday – investor hopes of fiscal spending, tax cuts and regulation rollback under the Trump administration is fuelling their appetite.
Japan’s Nikkei Stock Average closed up +1.8%, while Hong Kong’s Hang Seng Index rose +1.4% to hit a three-month high, following four straight sessions of gains. The Korea Kospi added +0.8% and Singapore’s FTSE Straits Times Index was up +0.6%.
Note: Markets in Australia were closed for a holiday while markets in China, South Korea, Taiwan, and Vietnam will be closed tomorrow, with China closed through next Thursday because of the Lunar New Year.
In Europe, equity indices are again trading higher across the board, with most bourses being led by financial stocks. Energy, commodity and mining stocks are generally lower in the FTSE 100 as oil and copper trades under pressure intraday.
In the U.S., equities are set to open in the black (+0.1%).
Indices: Stoxx50 +0.2% at 3,338, FTSE +0.2% at 7,178, DAX +0.6% at 11,875, CAC 40 +0.3% at 4,894, IBEX 35 +0.5% at 9,599, FTSE MIB +0.6% at 19,697, SMI (NYSE:SMI) +1.0% at 8,474, S&P 500 Futures +0.1%
2. Oil finds support from weak dollar, gold under pressure
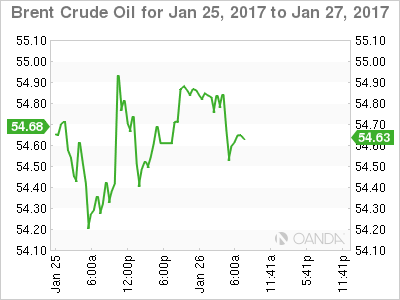
Ahead of the U.S. open, oil prices are on the rise, driven up by a weakening dollar. However, expect gains to be capped by plentiful supplies and bulging inventories despite efforts by OPEC to cut output.
Brent futures are up +50c a barrel at +$55.58, while U.S. light crude (WTI) is up +40c at +$53.15.
Yesterday’s report from the U.S. Energy Information Administration (EIA) showed an increase of +2.84m barrels last week in crude inventories to +488.3m barrels – which suggest there is plenty of supply in the world’s biggest market.
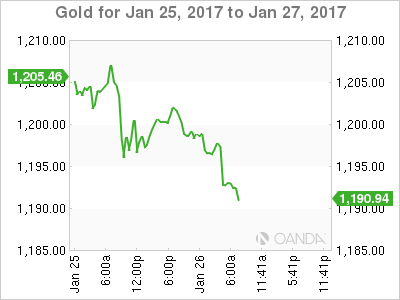
Overnight, gold prices have fallen -0.4% to +$1,196.35 an ounce after dropping -1.4% over the previous two sessions as optimism around corporate U.S. earnings continue to fuel the markets risk appetite.
Note: The metal reached its highest level since November on Tuesday when the bullion touched +$1,219.59.
3. Global sovereign yield curves continue to steepen
This week, U.S. bonds have witnessed whipsaw-trading action.
On Monday, bond prices rallied on concerns that Trump’s protectionist approach on trade could hurt growth. On Tuesday, POTUS refocused attention on the possibility of increased fiscal spending, which helped send bonds to their biggest one-day selloff in more than a month. Haven assets were again under pressure yesterday, with selling in government bonds sending the yield on the benchmark U.S. 10's to a new year high yields north of the psychological +2.50% to close out at +2.528%.
Note: A soft auction of U.S. 5-Year notes yesterday helped spark further selling in the Treasury market.
This morning, in the UK, yields on 10-Year gilts have climbed to an intraday high after the preliminary Q4 U.K GDP figure came in better than expected (see below). Yields have touched +1.53% after the GDP release. In Japan, the yield on the benchmark 10-Year JGB’s rose to +0.090% in late Asian trade, its highest level since Dec. 16. Similar debt maturities in Singapore, South Korea, Hong Kong, Indonesia and Malaysia have all edged higher.
4. Dollar to find reflation support soon
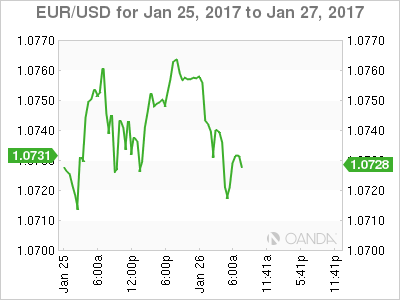
The mighty USD has yet to take advantage of the renewed “reflation” trade over the past few sessions. Ardent dollar ‘bull’ supporters believe the current divergence of the buck from U.S. bond yields should not last too much longer, convergence seems to be beginning ahead of today’s U.S open as the greenback drift away from its two-month lows.
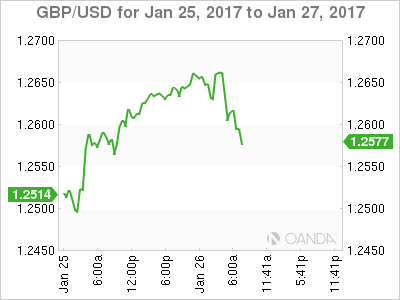
Europe’s single unit is trading atop of the psychological €1.0700 handle. The UK’s pound was initially firmer in this morning’s session and seems to be tentatively holding on to these gains (£1.2636) for the time being after the UK’s Q4 GDP (see below) beat expectations, but matched its lowest annual pace since Q1 2013.
USD/JPY seems to be embracing the yield differential argument and is currently trading up +0.8% at ¥114.26.
5. U.K grows +0.6% in Q4
Data this morning indicated that the UK economy grew steadily in Q4. At +0.6% it’s further proof that Britain was one of the fastest-growing major economies last year despite June’s Brexit vote.
Growth for the year as a whole was +2%, mostly driven by Britain’s dominant services sector, especially retail sales, which highlights the importance of the UK consumers in keeping PM Theresa May’s economy ticking over.
Note: Consumers’ hardiness will be tested this year as quickening UK inflation from a weaker pound is expected to squeeze household spending.
