Tuesday April 3: Five things the markets are talking about
Regional euro bourses have reopened after the long weekend under pressure, but the declines, thus far, are muted when compared to yesterday’s US equity selloff, while in Asia, stocks were able to pare some of their initial drop. The US dollar is again under pressure vs. its G10 counterparts, while Treasury prices edge lower.
The key concerns among investors are trade conflicts between the US and other countries and higher interest rates in the US. Q1 has been the worst three-months for global equities in more than 24-months and Q2 has started on the back foot in risk off mode as the market prepares for earnings season. Consensus anticipates a strong showing, but the market will be watchful for any more signs of a slowdown in the global expansion.
1. Stocks mixed results
On Monday, major US indices fell -2%, with early pressure likely exacerbated by the holiday trading schedule and heightened by further trade war worries, though markets ended well off the day’s lows.
The S&P 500 closed below its 200-day moving average for first time since mid-2016 amid pressure on tech names. The VIX rose above 25 for the first time in 10-days.
Overnight in Japan, stocks fell, led by tech firms and makers of electronic components. The Nikkei ended -0.5% lower, while the broader Topix dropped -0.3%.
Down-under, Aussie shares ended slightly lower on Tuesday, as gains in material stocks and a surge in energy names countered losses in financial and industrial stocks. The S&P/ASX 200 index closed down -0.13%, marking its third consecutive day of losses. In S. Korea, the KOSPI skidded about -1%, pressured mostly by Samsung Electronics (KS:005930) being down more than -1%.
In Hong Kong, stocks reversed earlier losses to edge higher overnight, led by gains in consumer goods makers, although caution prevailed amid escalating trade tensions after Beijing unveiled retaliatory trade measures against the US. At close of trade, the Hang Seng index was up +0.3%, while the Hang Seng China Enterprise (CEI) closed up +1.2%.
In China, stocks ended lower on Tuesday, amid resurgent trade war fears after Beijing unveiled retaliatory trade measures against the US. At the close, the Shanghai Composite index was down -0.8%, while the blue-chip Shanghai Shenzhen CSI 300 index declined -0.6%.
In Europe, regional bourses trade lower across the board following closures for Easter Holidays, after a sharp sell off stateside yesterday. No surprise to see technology names are under pressure in the region, mirroring what happened on Wall St.
US stocks are set to open in the black (+0.4%).
Indices: STOXX 600 -1.0% at 367.3, FTSE -0.8% at 7002, DAX -1.4% at 11925, CAC 40 -0.9% at 5122, IBEX 35 -0.9% at 9510, FTSE MIB -0.7% at 22254, SMI -1.3% at 8627, S&P 500 Futures +0.4%
3. Oil inches up, but rising Russian output still weighs, gold higher
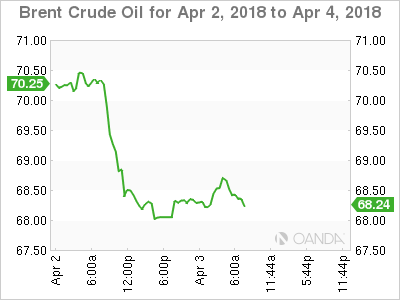
Oil prices have inched higher overnight as rising Russian output and expectations of a reduction in Saudi Arabian crude prices were offset by a potential slowdown in US production.
Brent Crude futures are at +$67.84 per barrel, up +20c, or +0.3%, after it fell more than -2% on Monday. US Crude Oil WTI Futures are at +$63.2 a barrel, up +18c, or +0.3% from yesterday’s close.
For ‘long’ crude positions, they are worried that top exporter Saudi Arabia will cut prices for all crude grades it sells to Asia in May and are also concerned about Russia’s production numbers – Russia pumped +10.97m bpd of crude in March, up from +10.95m bpd in February – an 11-month high.
However, supporting the crude ‘bulls’ is last week’s Baker Hughes data which showed that US drillers cut -7 oil rigs in the week to March 29, bringing the total down to +797, the first decline in three-weeks.
The market will take its cues from this week's inventory reports. Weekly official EIA data, which includes production figures, is due to be published on Wednesday.
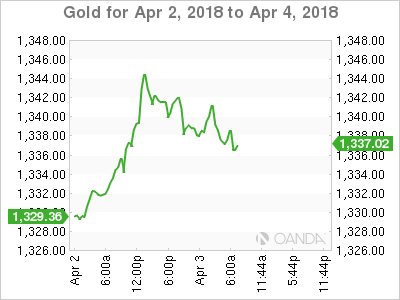
Ahead of the US open, gold prices rose slightly overnight after a more than +1% gain in the previous session, as mounting global trade tensions fueled demand for the safe-haven metal. Spot gold is up +0.1% at +$1,341.68 per ounce.
Note: The ‘yellow’ metal climbed +1.3% on Easter Monday, its biggest one-day percentage rise in a week.
3. Sovereign yields trade atop of two-week lows
As widely expected, the Reserve Bank of Australia (RBA) ended yesterday’s April policy meeting with the benchmark rate unchanged at +1.5%, where it has been for the last 20-months.
Governor Lowe expects inflation to “remain low for some time,” reflecting “low growth in labor costs and strong competition in retailing.” “Further progress in reducing unemployment and having inflation return to target is expected, although this progress is likely to be gradual.”
The Governor has repeatedly emphasized that the central bank sees no strong case for a near term hike in rates, exhibiting policy patience.
In Europe, sovereign bonds trade barely changed early in the first trading day of Q2. The Germany 10-Year Bund yield is trading flat at +0.49%, while 10-year Spanish, Italian and Portuguese bond yields are trading about +1 bps higher. There is no supply scheduled in the eurozone today, with the week’s first bond auction due tomorrow when Germany taps five-year debt, followed by Spain and France on Thursday.
Note: Consensus expects the eurozone bond markets may run into some profit taking from short-term investors after their strong performance in the last 10-days.
Elsewhere, the yield on United States 10-Year Treasuries has gained +1 bps to +2.74%, the biggest advance in more than a week, while the United Kingdom 10-Year Gilt yield has decreased -1 bps to +1.35%, reaching the lowest in more than 10-weeks on its seventh straight decline.
4. Dollar at a crossroads
As we officially start Q2, the market begins to debate the US dollars direction. Will it trend or continue to move sideways in the quarter? The April-May period historical is one of “extending price moves for forex.” The techies would very much welcome a change and are expecting a new fresh trend to materialize over the coming weeks.
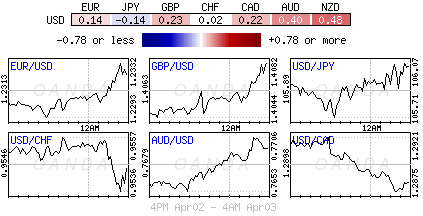
The EUR/USD (€1.2311) has been locked in a +350 pip range for most of Q1. Momentum is expected to build whenever there is a real break of either €1.2100 or €1.2500. Until then, the majority will play the four-handle range.
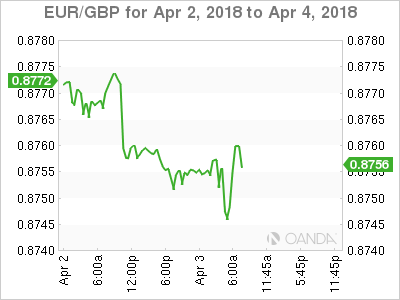
The pound (£1.4069) did not react much to this morning’s U.K manufacturing PMI for March (see below), which came in at 55.1, compared with 55.0 in February, above forecasts for 54.4. GBP/USD last traded up +0.1% on the day at £1.4069, little changed from before the release. EUR/GBP is also little changed at €0.8753, down -0.1% on the day. The pound has also been unfazed by reports that the ECB is said to have told U.K. banks to prepare for a scenario where there was “no deal” leading to a hard Brexit with no transition.
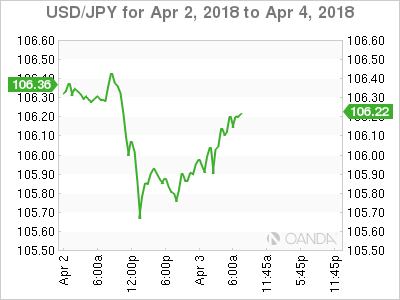
Finally, USD/JPY (¥106.18) briefly dipped below the psychological ¥106 level as BoJ’s Governor Kuroda testified in parliament that the BoJ was internally discussing an exit, and the way forward to depend on prices, economy and markets.
5. U.K manufacturing PMI muted
Data this morning showed that the U.K manufacturing sector maintained a steady pace of expansion during March. Output growth picked up, although this was offset by slower increases in both new orders and employment.
The seasonally adjusted IHS Markit/CIPS Purchasing Managers’ Index posted 55.1 in March, little-changed from 55.0 in February.
Note: The average reading over Q1 (55.1) was the weakest in a year, suggesting that the underlying pace of expansion has been generally slower since the start 2018.
Digging deeper, on the price front, rates of inflation in input costs and output charges remained elevated despite easing slightly since February.
Manufacturing production rose for the twentieth successive month in March. The rate of expansion accelerated to the sharpest in the year-so-far, despite a moderation in growth of incoming new orders.
