My World Market Wrap-Up for 2013 can be found here.
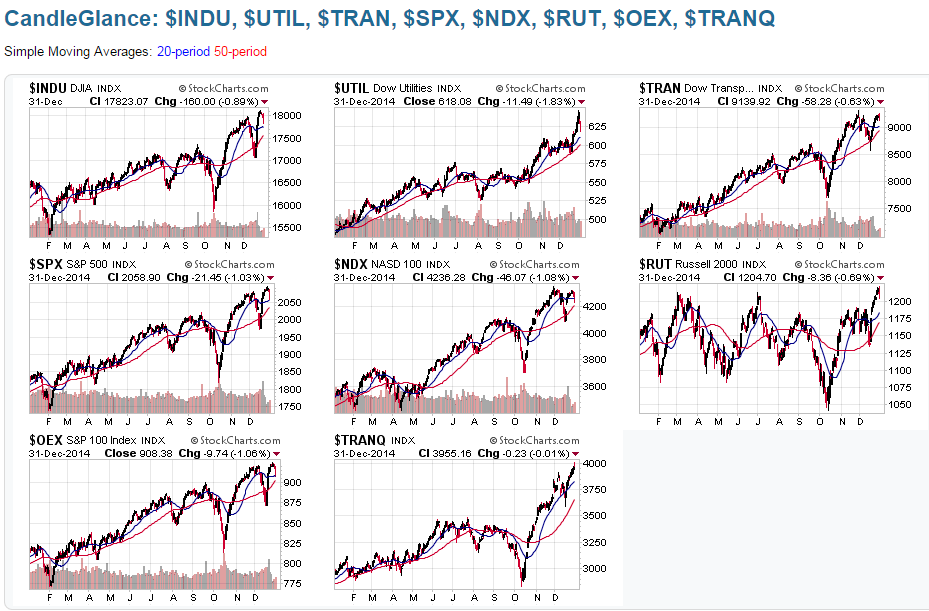
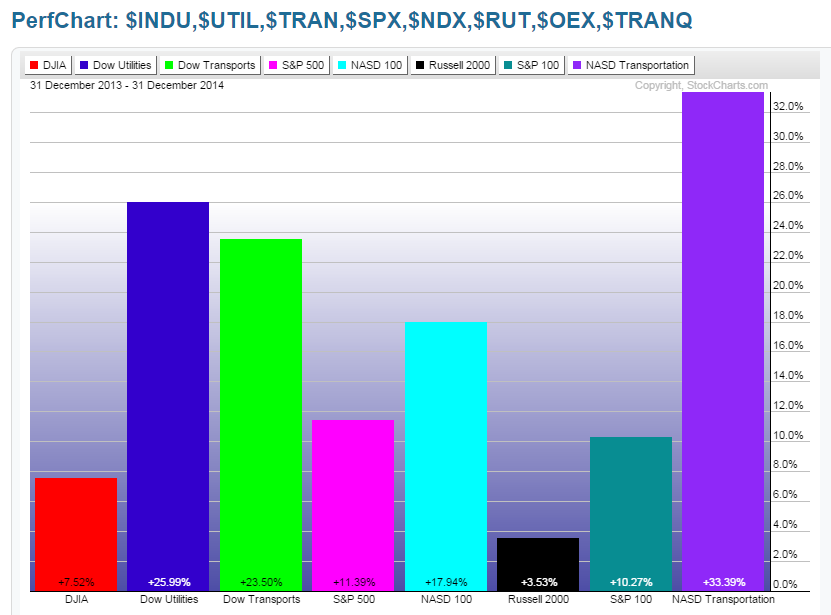
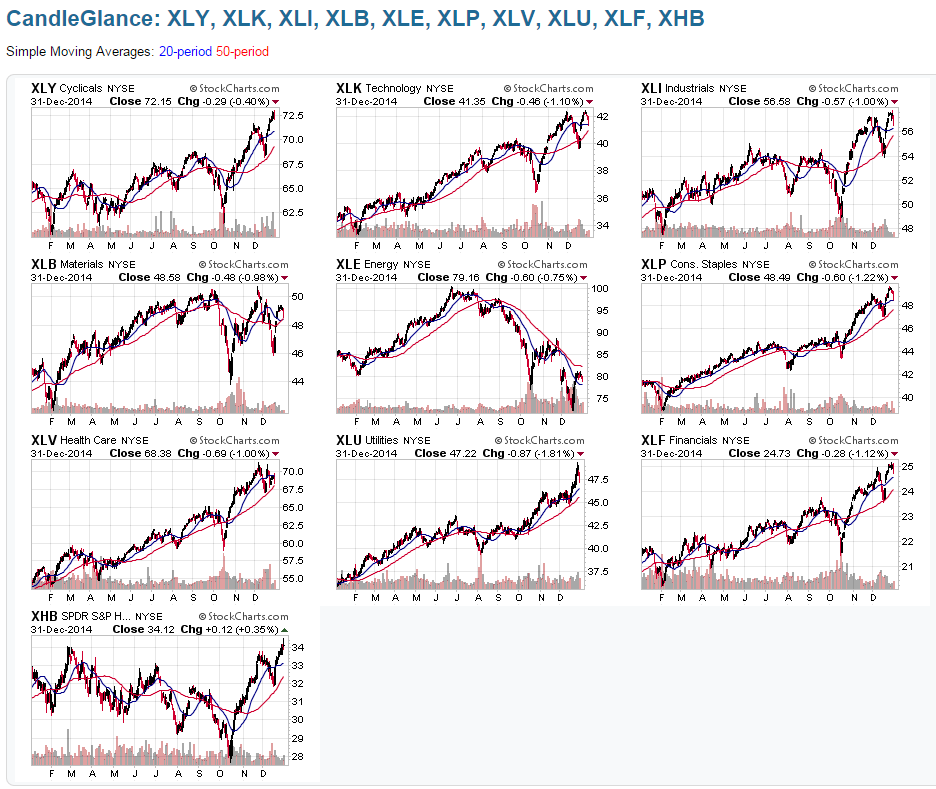
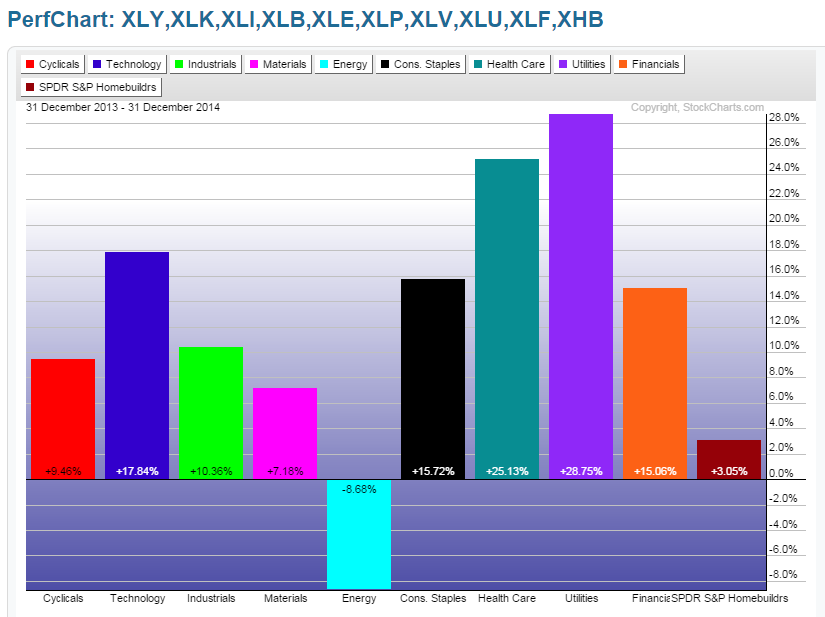
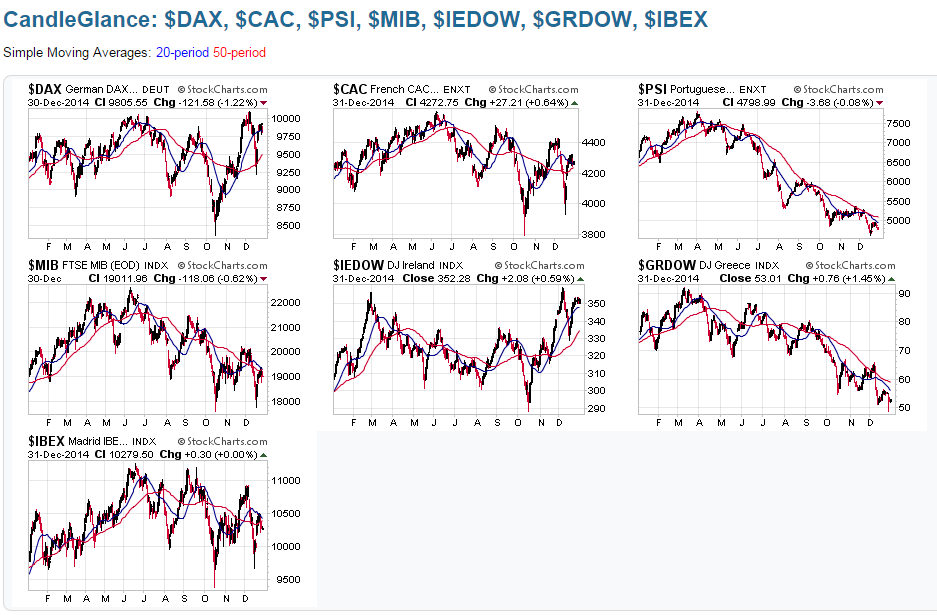
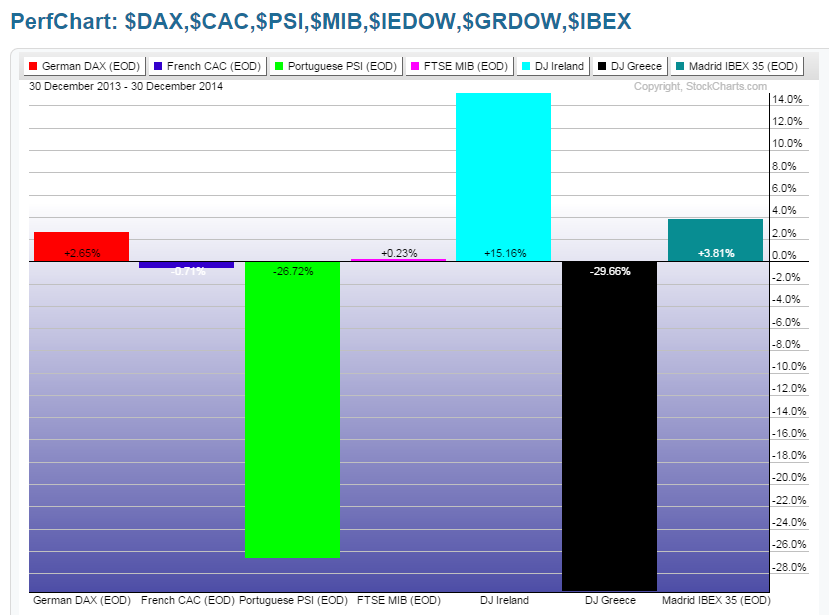
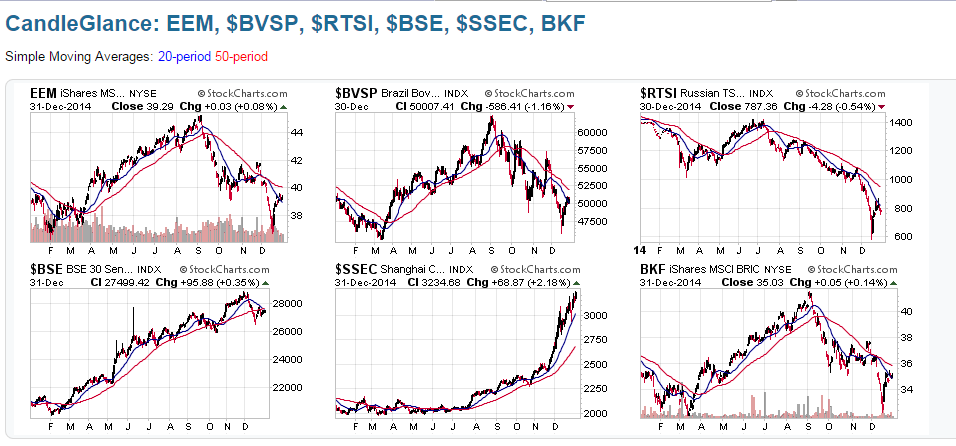
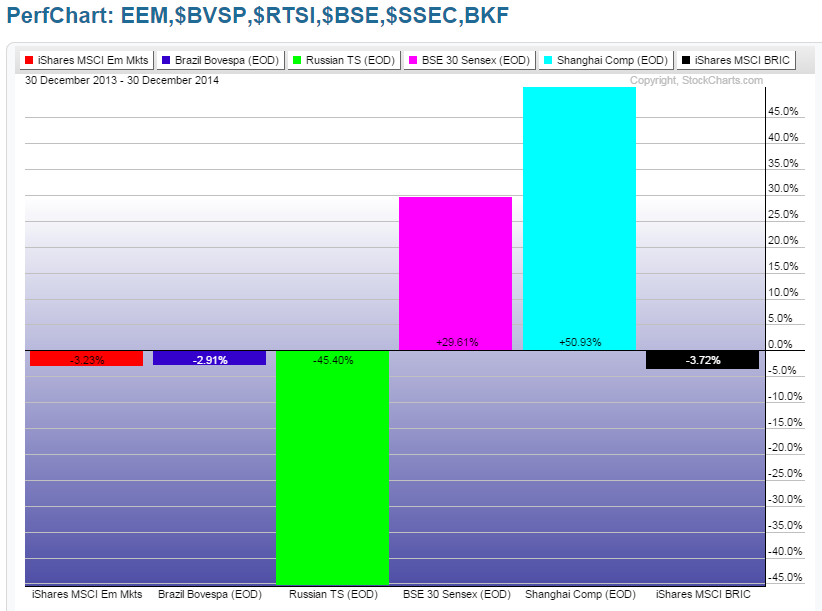
The following charts and graphs show the trends and gains and losses made in a number of world markets for 2014. They will be shown without individual comment, initially, as you can see at a glance where major support and resistance are (50 MA in both cases), and where the outliers are (which ones made the most gains or losses for the year).
Major U.S. Indices
Major U.S. Sectors and Homebuilders ETF
Germany, France and PIIGS Countries
Emerging Markets ETF, BRIC Countries and BRIC ETF
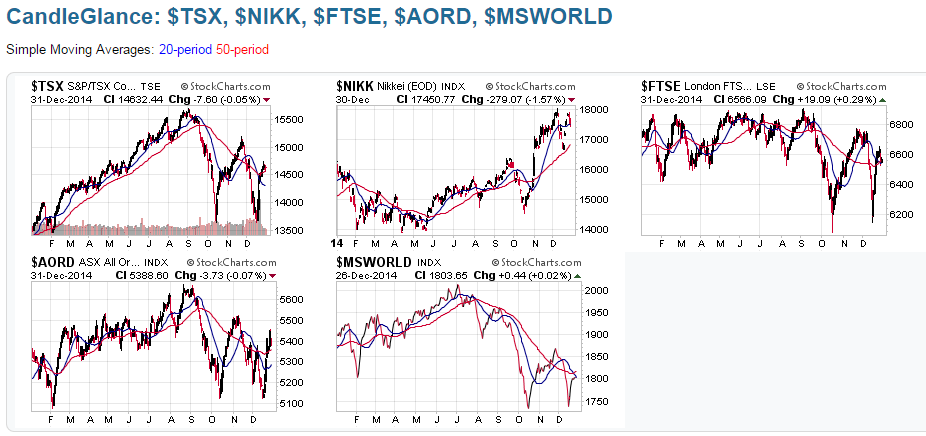
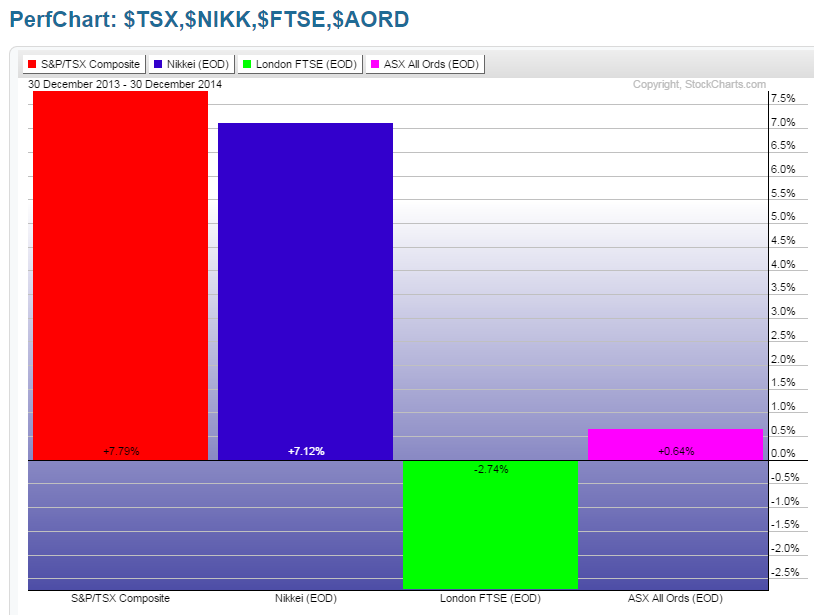
Canada, Japan, UK, Australia and World Index
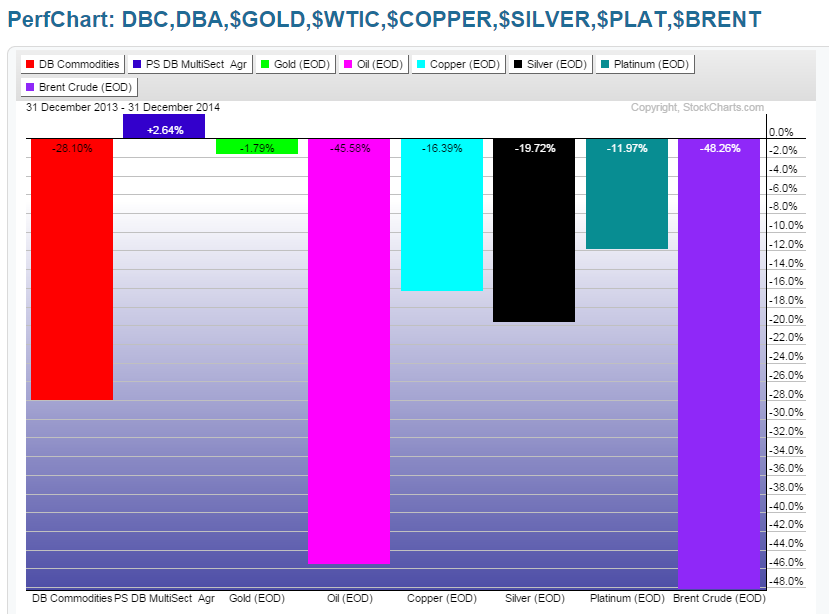
Commodities ETF, Agricultural ETF, Gold, WTIC Oil, Copper, Silver, Platinum and Brent Oil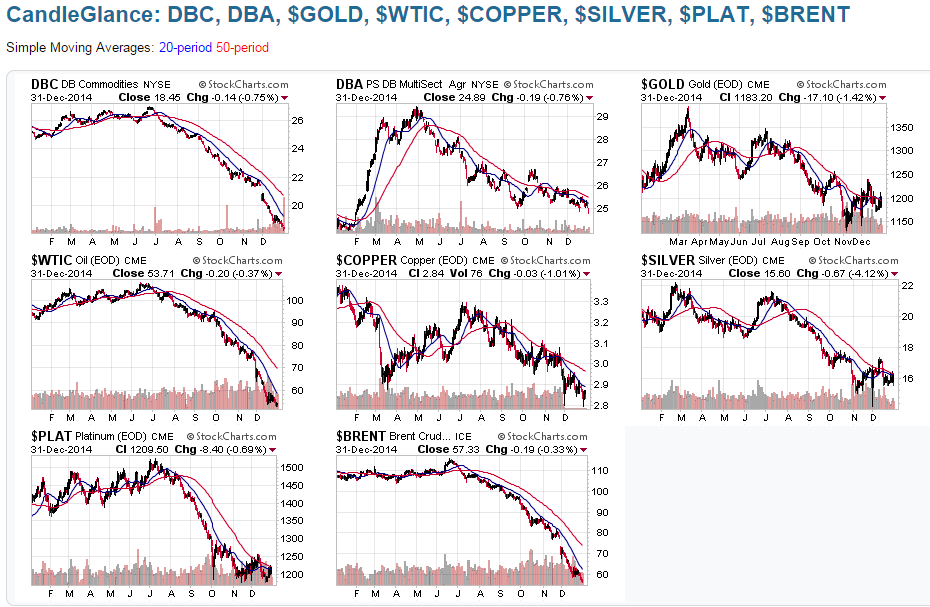
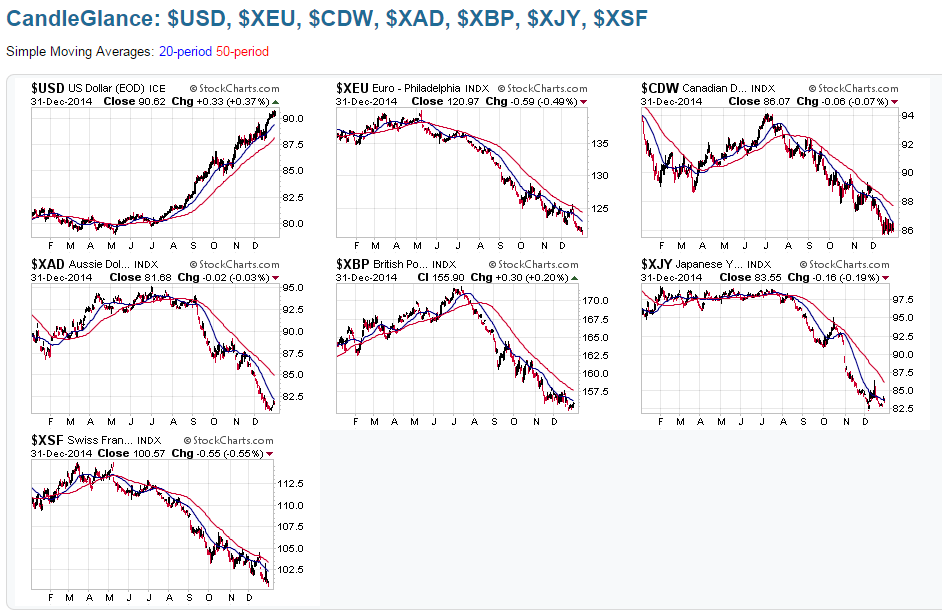
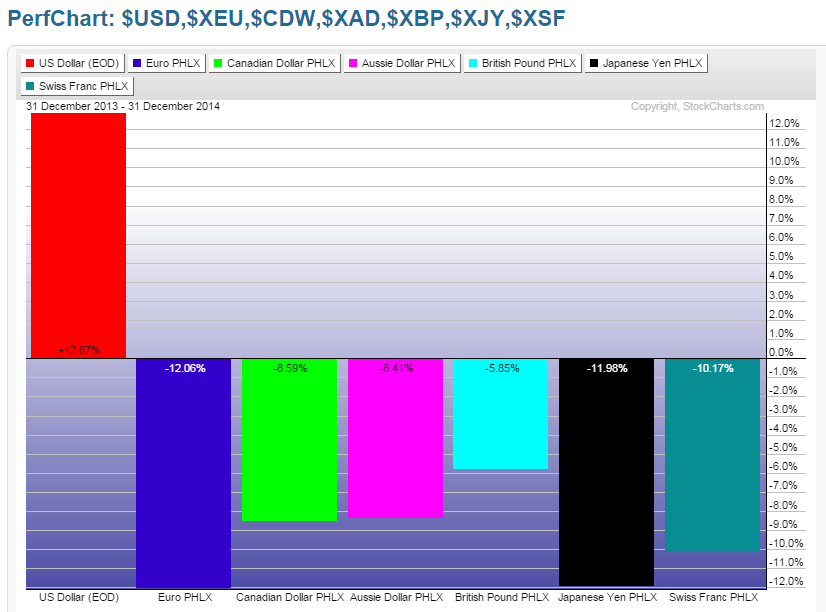
USD, Euro, Canadian$ Aussie, British Pound, Japanese Yen and Swiss Franc
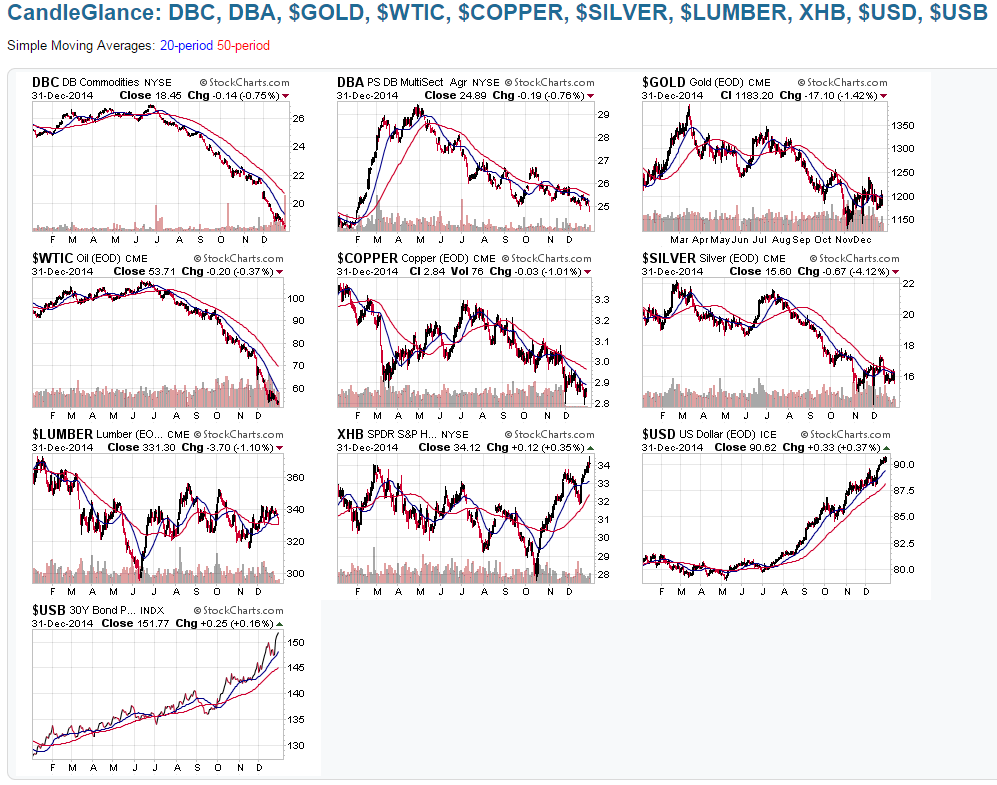
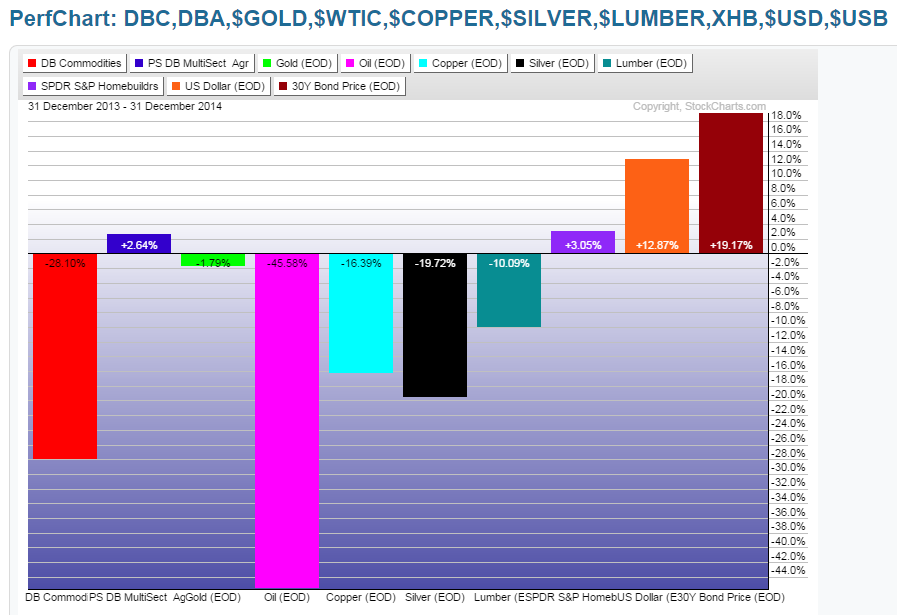
Commodities + Lumber, Homebuilders ETF, USD and U.S. Bonds
SUMMARY
Markets that made the strongest gains in 2014:
- Nasdaq Transportation Index
- Dow Utilities Index
- Dow Transports Index
- Nasdaq 100 Index
- Healthcare ETF (SPDR - Health Care (ARCA:XLV))
- Consumer Staples ETF (SPDR - Consumer Staples (ARCA:XLP))
- Financials ETF (Financial Select Sector SPDR Fund (ARCA:XLF))
- Ireland
- Shanghai
- India
- U.S. Dollar
- U.S. Bonds
- Dow 30 Index
- S&P 500 Index
- S&P 100 Index
Markets that closed mildly positive in 2014:
- Materials ETF (SPDR Materials Select Sector (ARCA:XLB))
- Cyclicals ETF (SPDR Consumer Discretionary. Select Sector (ARCA:XLY))
- Industrials ETF (Industrial Sector SPDR Trust (ARCA:XLI))
- Toronto
- Japan
Markets that made the most losses in 2014:
- Energy ETF (SPDR Energy Select Sector Fund (ARCA:XLE))
- Portugal
- Greece
- Russia
- Commodities ETF (PowerShares DB Commodity Index (ARCA:DBC))
- Brent Crude Oil
- WTIC Oil
- Silver
- Copper
- Platinum
- Euro
- Japanese yen
- Swiss franc
- Canadian dollar
- Aussie dollar
- British pound
- Lumber
Markets that closed relatively flat for the year:
- Russell 2000 Index
- Homebuilders ETF (SPDR S&P Homebuilders (NYSE:XHB))
- Germany
- France
- London
- Spain
- Emerging Markets ETF (iShares MSCI Emerging Markets (ARCA:EEM))
- Brazil
- BRIC ETF (iShares MSCI BRIC Index Fund (NYSE:BKF))
- Australia
- Agricultural ETF (PowerShares DB Agriculture Fund (ARCA:DBA))
- Gold
CONCLUSIONS
U.S. markets outperformed most other world markets, as did the U.S. Dollar and U.S. Bonds. However, Small-Caps (via RUT) traded in a large sideways trading range, but this index looks poised to break to the upside. Watch to see if the 20 MA remains above the 50 MA (both are currently rising) to signal continued strength. Otherwise a cross below could signal a general weakening in U.S. equities.
Of the commodity-producing countries, Canada has been performing better than Australia (which is not confirming the dramatic rise in the Shanghai Index). We'll see if bubble-like conditions are ripe yet for some hefty profit-taking to occur in China.
Portugal and Greece have been weighing on the EU countries. Unless these pick up, I don't expect much improvement in the near term for this group.
A drop and hold below $50 on WTIC Oil could very well weaken and spark a major sell-off in U.S. equities, as could continued weakness in Lumber, Copper, and the Homebuilders Sector. However, if Oil stabilizes around $60-$75, we may see a short rebound in the accumulation of the riskier sectors until, say, May or June.
Markets have favoured the "Defensive" Sectors this past year. This may very well continue as long as the above-mentioned groups remain weak. Any dramatic weakening of these groups could very well weaken and spark a major sell-off in U.S. equities. We may get some early signals of such a scenario in Forex and U.S. bonds, so I'd watch the U.S. dollar performance against the above currencies for signs of strengthening or weakening.
In any event, I think market volatility will increase and markets will consolidate in large trading ranges for longer periods of time in between moves, especially if we see a softening in the U.S. labour markets, wages, and company earnings, along with any increasing hawkish talk from the Fed. The S&P 500 Index gained 11.39% for the year. I think we'll be lucky to see half that increase in 2015...say around 5%.
