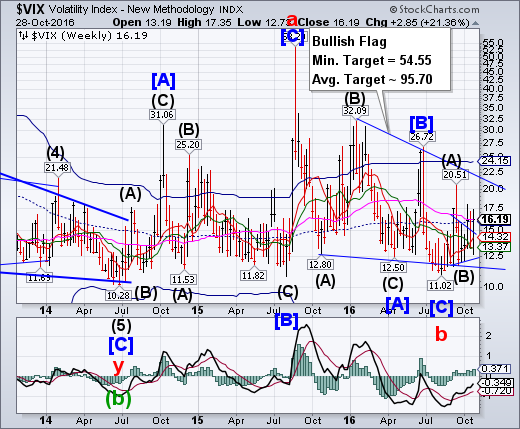
CBOE Volatility Index closed above its Long-term support/resistance at 16.15, confirming its buy signal.The next important milestones are the trendline at 22.50 and Cycle Top resistance at 24.15 where a long-term breakout of the Bullish Flag may occur and the Cyclical uptrend may resume in earnest.
(ZeroHedge) While VIX remains subdued at bull-market-narrative-confirming levels, there are extreme concerns being exhibited in VIX options. There are currently almost 7 times more 'call' options (bets on a higher VIX) than 'put' options outstanding on the 'Fear' index - the highest since August 2015, just days before China devalued and the US equity market crashed.
SPX declines to key support.
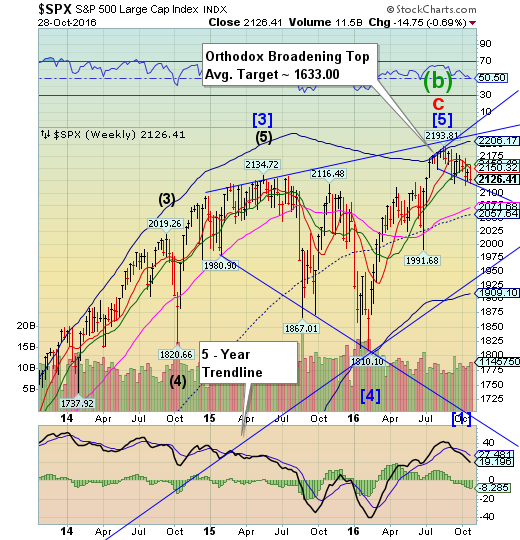
SPX bounced early this week, but closed beneath its Intermediate-term support/resistance at 2158.49, confirming the sell signal. In addition, weekly Short-term support/resistance has made a bearish cross of the intermediate-term support/resistance. However, the more important target may be that of the Orthodox Broadening Top with its lower trendline at 2120.00, where a break may trigger that formation. Should that support be broken, a panic may follow.
(RealInvestmentAdvice) The problem with going nowhere is that it makes managing money much more difficult. With the market having broken the bullish trend line from the February lows, as shown below, along with remaining overbought with a sell signal in place, the risk to the downside outweighs the potential for a further advance currently. With downtrend resistance from the previous highs pushing prices lower, the risk of a break below 2125 is elevated.Being a bit more cautious given the current technical backdrop will likely be prudent.
While there are many simply suggesting just to buy into passive indexes and hold them, the brutal reality to such strategies have destroyed the ability for many to ever actually reach their investment goals. However, despite the weight of evidence suggesting the markets are currently in a third bubble since the turn of the century, the commentary to ignore the outcomes related to such asset inflations is actually quite astonishing. Such is the result of a market seemingly immune to declines due to continued support, or at least belief thereof, from Central Banks.
NDX makes a new high, closes beneath Short-term support.
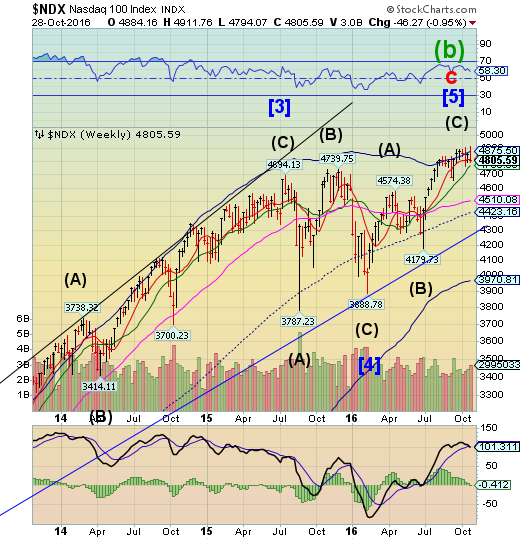
In a surprising turnabout, NDX made a new high on Monday, then declined and closed beneath short-term support at 4818.16, leaving it on a sell signal at the end of the week.This behavior is leaving investors uncertain what to expect next. However, a decline beneath Intermediate-term support at 4768.59 confirms the sell signal. It may be imprudent to be long beyond that point.
(WSJ) U.S. stocks fell Friday, ending a week dominated by quarterly earnings reports.
The S&P 500 and the Nasdaq Composite fell this past week, while the Dow Jones Industrial Average posted a slight gain. The losses coincided with a selloff in government bonds that pushed yields to their highest levels in five months.
The Dow Jones Industrials fell 8.49 points, or less than 0.1%, to 18161.19 on Friday, and the NASDAQ Composite lost 25.87 points, or 0.5%, to 5190.10.
Government bonds stabilized after two days of sharp price declines. The yield on 10-Year U.S. Treasury note edged higher Friday to 1.847%—its highest yield since May 27.
Stocks pulled back from earlier gains after the Federal Bureau of Investigation said it was reviewing new evidence in connection with its investigation of Democratic presidential candidate Hillary Clinton’s email server.
Dow Jones High Yield Select 10 consolidates.
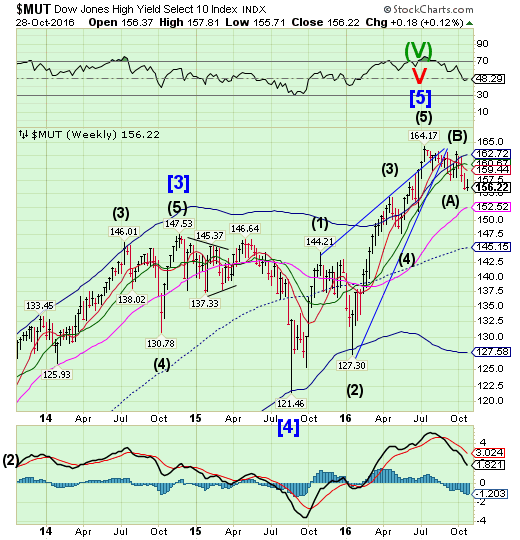
The High Yield Bond Index bounced early in the week, but eased back down, leaving a small gain for the week. The Cycles Model suggests more selling ahead.
(BusinessInsider) The fate of the bond market lies with a handful of giant investors.
The top five investment companies hold $264 billion in US high-yield bonds, according to a big report from Stephen Caprio and Matthew Mish at UBS. That's equivalent to 20% of the market.
The top 20 hold $605 billion, equivalent to 46% of the US high-yield market, and mutual funds and separately managed accounts hold 70% of the market.
That could be a problem, according to Caprio and Mish.
In their report, the analysts explore what is called concentration risk and argue that having a high level of mutual fund ownership in the high-yield market could lead to wild swings in prices.
USB retests the trendline.
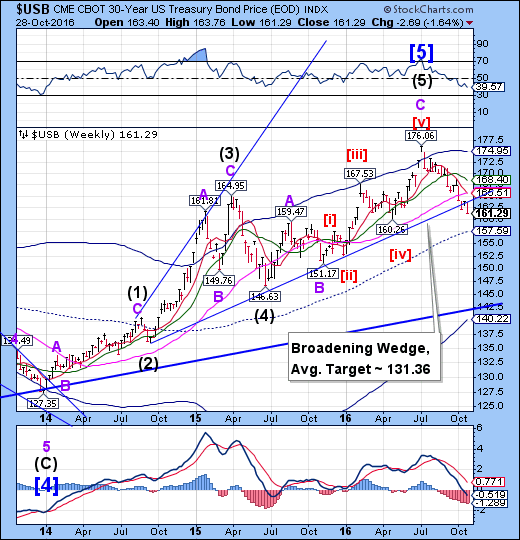
The Long Bond has unequivocally broken beneath its trendline, leaving both time and space to fill before reaching its low. The Cycles Model suggests there is still time for the decline, possibly to mid-November. The space to fill may be the breach between the current price and the mid-Cycle support at 157.59. However, a panic may propel USB to its 35-year trendline at 142.50.
(WSJ) The weeks long selloff in global government bonds gained momentum on Thursday, sending the yield on the benchmark 10-year U.S. Treasury note to its highest in nearly five months.
The yield on the 10-year Treasury note settled at 1.843%, up from 1.79% on Wednesday. Yields rise as bond prices fall. Some traders say the yield could retest the 2% mark again if the higher yield momentum intensifies. The most-recent time the yield traded above 2% was in March. Some investors say yields around 2% would be appealing to buy, as they don’t expect yields to rise sharply in a soft-growth world.
The Euro retests the neckline.
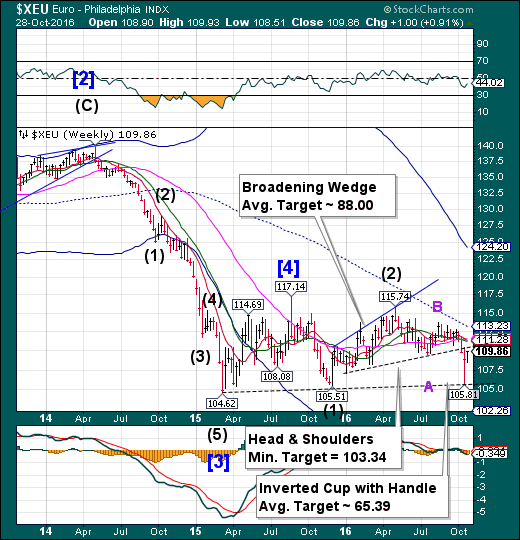
The Euro appears to be retesting its Head & Shoulders neckline at 110.00, after which it may decline to its Head & Shoulders target in short order. The breakdown brought more bad news in the form of an inverted Cup with Handle formation which indicates a further probable longer-term decline beneath its March and December 2015 lows.
(ExchangeRates) Earlier on, investors were eagerly anticipating the US Q3 GDP growth rate result, which ultimately rose above forecasts from 1.4% to 2.9%. This failed to boost the US Dollar against the Euro, however, as the US personal consumption figure, showing consumer spending, fell dramatically from 4.3% to 2.1%.
At the time of writing, the Euro was strong against the US Dollar, printing at 1.09. Although French GDP fell short of forecast in the third quarter this didn’t prevent the Euro to Dollar exchange rate from making further gains on Friday morning.
An unexpected uptick in Eurozone economic confidence encouraged investors to continue favouring the Euro over its rival, particularly with expectations positive for the afternoon’s German CPI results.
Euro Stoxx 50 makes a new 6-month high.
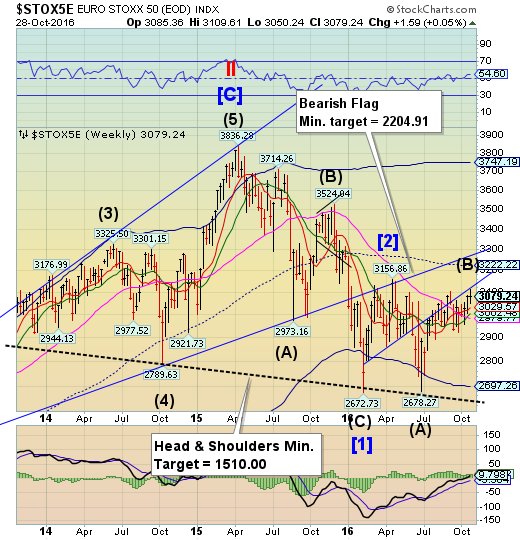
The Euro Stoxx 50 Index rallied to a new 6-month high on Monday in a Cycle inversion, but was repulsed at the lower trendline of a Bearish Flag formation on Tuesday.The wide swings suggest a return of volatility that may influence price to the downside, as the Bearish Flag suggests. The Head & Shoulders formation may also come into play as Stoxx decline.
(CNBC) European markets closed slightly lower Friday as the earnings season continues amid heightened expectations that the U.S. Federal Reserve will raise rates in the near-term.
The pan-European STOXX 600 was off its session lows, but nonetheless provisionally closed down 0.32 percent. The FTSE 100 ended the day up 0.15 percent while the German DAX was off 0.24 percent. In France the CAC 40 up by 0.24 percent.
The Yen extends its low.
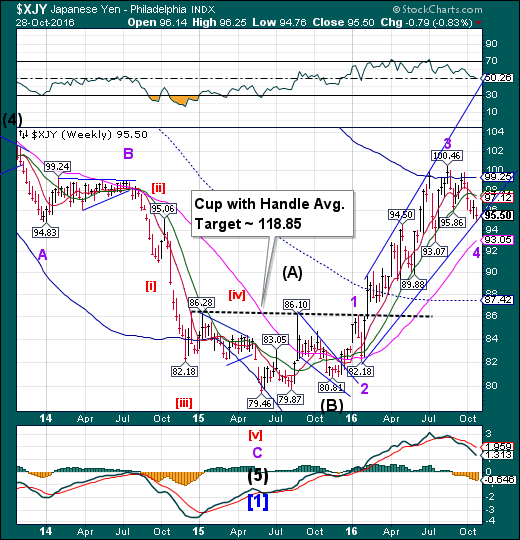
The Yen appears to have extended its Master Cycle low by another week. These extended Cycles appear to be happening across the board, delaying a potential rally in the Yen. Once the Cycle decline is finished, a new period of strength may emerge, possibly lasting through the election.A breakout above the high at 100.46 confirms the next move may be dramatically higher.
(Bloomberg) The yen is set for its biggest monthly loss since May amid speculation the Bank of Japan will maintain monetary stimulus as the Federal Reserve prepares to raise interest rates for the first time since December..
Japan’s currency has weakened against eight of its 10 major peers since Sept. 30 as Governor Haruhiko Kuroda and his colleagues prepare to set policy on Nov. 1. Economists anticipate U.S. gross domestic product data on Friday will show an improvement, paving the way for a rate hike. The market-based chance of a December increase by the Federal Reserve rose to 73 percent, from 68 percent at the end of last week.
The Nikkei 225 extended its retracement.
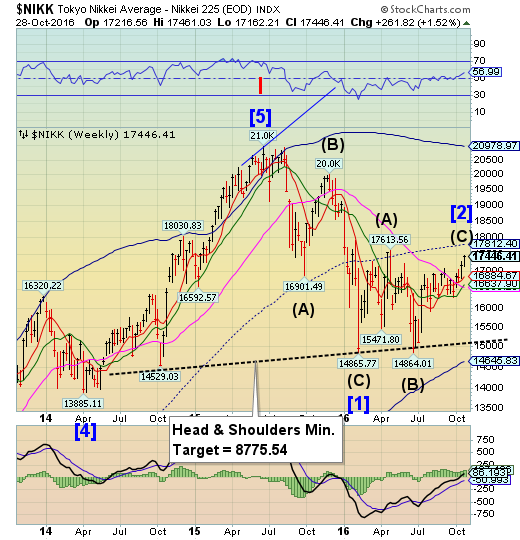
The Cycles in the Nikkei have also inverted making a Cycle high this week instead of a low. But it has reached the technical limit of its retracement. Inversions have a tendency to retrace themselves, either partially or fully, in a very short time period following the inversion period. Should the Head & Shoulders neckline be broken, a panic decline may ensue.
(Japan Times) The Nikkei average rewrote its six-month high Friday, buoyed by purchases on the back of the yen’s weakening versus the dollar.
The 225-issue Nikkei average climbed 109.99 points, or 0.63 percent, to end at 17,446.41 on the Tokyo Stock Exchange, its best finish since April 22. On Thursday, the key market gauge retreated 55.42 points.
The Topix index of all first-section issues grew 10.40 points, or 0.75 percent, to 1,392.41, after falling 0.69 point the previous day.
U.S. Dollar reverses from the upper Descending Wedge trendline.
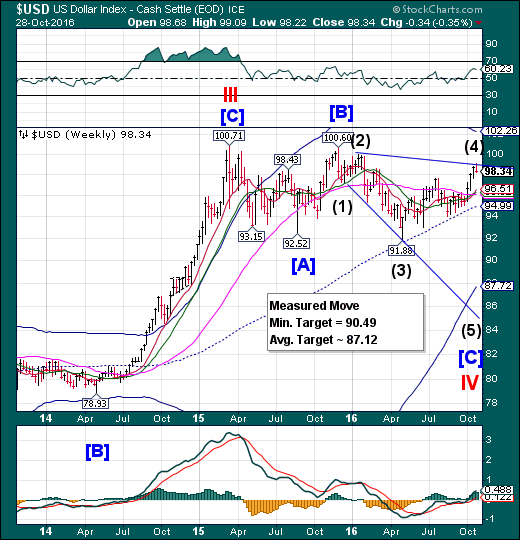
USD spiked to the Descending Wedge trendline, but began a reversal on Tuesday in yet another Cycle inversion. The reversal implies a complete retracement of the rally.The next two weeks may unhinge the Dollar bulls, since all the traders are on one side of the boat. The unwinding of those trades may cause a rapid move from bullish to bearish and may challenge mid-cycle support at 94.99 in the next move.
(Reuters) Speculators increased favorable bets on the U.S. dollar for a fifth straight week, with net longs touching their highest since late January, according to Reuters calculations and data from the Commodity Futures Trading Commission released on Friday.
The value of the dollar's net long position rose to $18.81 billion in the week ended Oct. 25, from $18.44 billion the previous week. U.S. dollar net longs have exceeded $10 billion for four consecutive weeks.
The dollar continues to be underpinned by a widely expected interest rate hike by the Federal Reserve at the December policy meeting. Friday's data showing that U.S. gross domestic product for the third quarter rose 2.9 percent, the fastest pace in two years, supported rate hike expectations. So far this month, the dollar index has risen 3 percent
Gold struggles to stay above Long-term support/resistance.
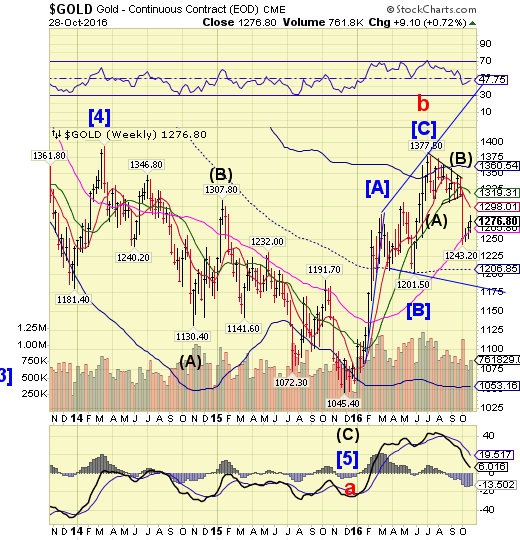
Gold continues to struggle to stay above its Long-term support at 1265.86, ending three weeks of retracement. The Cycles Model suggests that the gold Cycle is also inverting (making a high instead of a low), so it is probable that the decline may resume imminently. The next two weeks may be show a dramatic decline.
(Reuters) Gold rose 1 percent to the highest level in nearly four weeks on Friday, extending gains late in the session after the FBI said it will further investigate Democratic presidential candidate Hillary Clinton's use of a private email system.
Just 11 days ahead of the U.S. presidential election, the news shook up the campaign, in which Clinton is the front-runner in opinion polls.
Spot gold was up 0.8 percent at $1,278.38 an ounce by 2:54 p.m. EDT (1854 GMT), after rising 1.3 percent to $1,284.14,the highest since Oct. 4. It is on track to close the week up 0.9 percent.
U.S. gold futures settled up 0.6 percent at$1,276.80.
Crude reverses from mid-Cycle resistance.
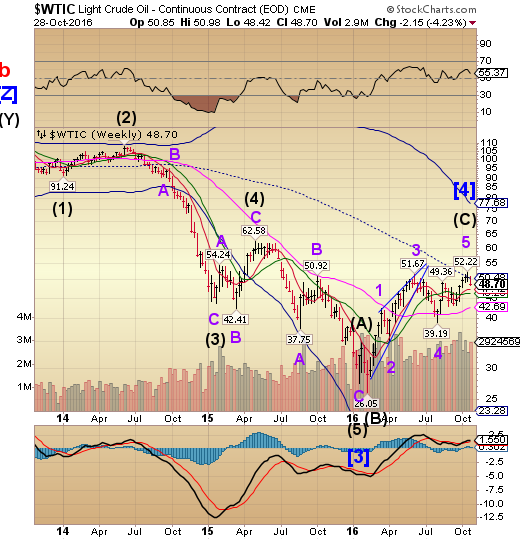
Crude reversed from its challenge of mid-Cycle resistance at 50.48. There is now the probability of an imminent decline that may test the February low. After 6 months of being range-bound, traders are sanguine about the outlook for crude.
(EIA) Short positions in West Texas Intermediate (WTI) crude oil futures contracts held by producers or merchants totaled more than 540,000 contracts as of October 11, 2016, the most since 2007, according to data from the U.S. Commodity Futures Trading Commission (CFTC). Banks have tightened lending standards for some energy companies as crude oil prices declined throughout 2014 and 2015, and some banks require producers to hedge against future price risk as a condition for lending.
Initiating a short position, or selling a futures contract, allows the holder to lock in a future price for a commodity today, which oil producers and end users can use as a way to hedge or mitigate price risk. Increased short positions may indicate that current futures prices are seen as sufficient to generate positive returns from drilling projects.
Shanghai Composite fails to break out.
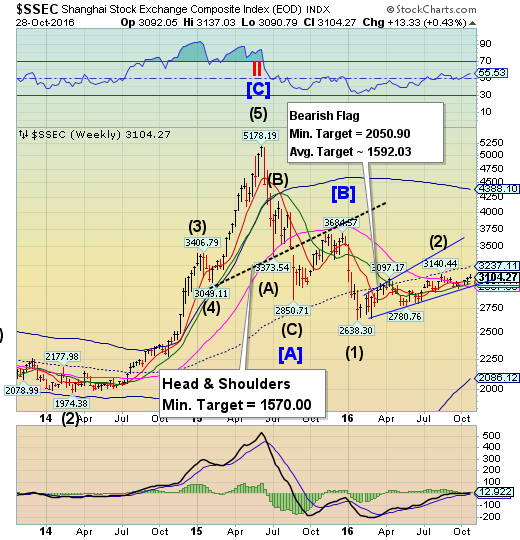
The Shanghai Index ended its attempt at a new high on Monday without a breakout.It is “in the window” for a strong decline, possibly a panic.The fractal Model suggests the Shanghai is due for another 1,000 point drop, possibly starting next week. The next Master Cycle low may be due by mid-November.
(Bloomberg) China’s central bank is conducting a trial monitoring of banks’ off-balance-sheet wealth-management products under its macro-prudential assessment system, according to people familiar with the matter.
The WMPs will be included in calculating broad-based credit, the people said, asking not to be identified discussing non-public information. Currently, the products aren’t included in the assessment framework, and it’s not clear when or if the People’s Bank of China will add them, the people said.
Citigroup Inc (NYSE:C). estimated that 13 trillion yuan ($1.9 trillion) of the products, which are a key building block in China’s shadow-banking system, could be covered.
The Banking Index throws over its Pennant trendline.
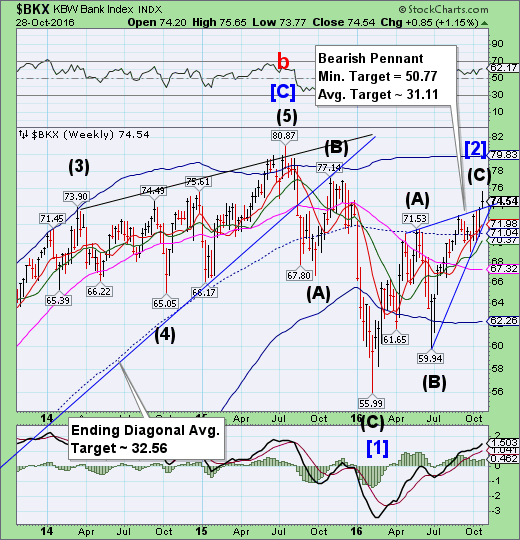
BKX “threw over” the upper trendline of its Bearish Pennant, suggesting a reversal may be at hand. The break point of the Pennant is at the weekly Short-term support at 71.98. Once broken, we may expect to see a very sharp (panic) decline.
(ZeroHedge) In what may or may not be a coincidence, just hours after Bloomberg reported that DB launched a probe into whether it "misstated" derivatives, moments ago the FT reported that the Bank of England is seeking details from large British banks on their current exposure to Deutsche Bank and some of the biggest Italian banks, including Monte dei Paschi, "amid mounting market jitters over the health of Europe’s financial sector."
The FT notes that the request was made in recent weeks by the BoE’s Prudential (LON:PRU) Regulation Authority as investors sold off Deutsche and Monte dei Paschi, both of which have been the subject of scrutiny over their capital levels. Supervisors worldwide have attempted to curtail the links between large institutions since the 2008 banking crisis, when the collapse of Lehman Brothers and other big groups threatened to drag down the entire global financial system.
(RealInvestmentAdvice) Following the end of each fiscal quarter, SEC registered corporations release their financial statements. Typically, investors and the media place a lot of importance on these results. Consequently, stock prices tend to rise or fall based on how the financial results compare to a consensus of estimates made by Wall Street analysts.
Since the beginning of the current quarter (10/1/2016), 76% of the 113 S&P 500 companies that have released earnings results have exceeded expectations. Like so many quarters before, many investors and media pundits are supporting the naïve conclusion that earnings are better than expected. Unfortunately, few investors are paying attention to the measurement tool, expected earnings, to gauge its usefulness as a measure of earnings quality. In this article we uncover the crafty game that Wall Street and corporate investor relations departments’ play to put a positive spin on earnings releases and at the same time give the impression that stock prices are cheap based on forward looking earnings expectations.
(ZeroHedge) After serving much drama to its shareholders - and global markets - over the past couple of months, when its stock tumbled to all time lows following the news of the bank's $14 billion DOJ settlement ask, Deutsche Bank provided some relief when earlier this morning it reported a modest, unexpected profit of €256 million for the third quarter on lower litigation and restructuring costs, beating consensus estimates of a €394 million loss, and a far better number than the €6 billion loss reported one year ago. Revenues were also a modest improvement to consensus expectations of €7.19BN, coming in at €7.49BN as a result of a 14% jump in fixed income trading revenues.
(ZeroHedge) One month ago when we showed that while Deutsche Bank is seriously undercapitalized it still has access to copious amounts of liquidity, which at June 30 stood at €223 billion but according to today's Q3 report has since dropped by some 10% to €200 billion, we pointed out one way that DB's currently safe liquidity position could turn precarious: it has deposits, and thus there is an all too real threat depositors may get nervous and start pulling them out. To wit:
This is where Deutsche Bank is very different from Lehman, and far riskier, because if the institutional panic spreads to the depositor base, which as the table below shows amounts to some €566 billion in total, and €307 billion in retail deposits...
(ValueWalk) Moody’s Capital Markets Research issued a damning verdict on Deutsche Bank earlier this week. In a research report put together by the credit agency’s ‘Analytics’ research division, Moody’s analysts write that Deutsche Bank AG (DE:DBKGn) (NYSE:DB) expected default frequency remains at one of the highest levels in the banking industry, despite the bank’s efforts to shore up its capital position.
