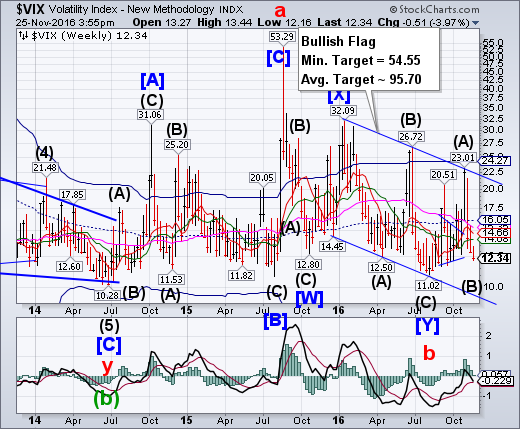
VIX declined to its lowest point in 2 months on Monday, while the VIX ETFs appear to have bottomed on Tuesday.If this is correct, then we may see the VIX and its ETFs rally for the next three weeks. The next important milestones are the Flag trendline near 22.50 and Cycle Top resistance at 24.27 where a long-term breakout may occur and the Cyclical uptrend may begin in earnest.The media is panning VIX, claiming it no longer signals danger in the markets.
(Bloomberg) Rest in peace, VIX. You're no longer the fear gauge for global markets.
The Bank for International Settlements has found a better barometer to capture the nervousness that starts as a slight reduction in global banks' leverage, is magnified by European lenders as a dollar squeeze in Asian supply chains, and reverberates around the world as a financial tightness felt by everyone.
Everyone, except the Chicago Board Options Exchange's Volatility Index.
S&P 500 rallies to its Cycle Top.
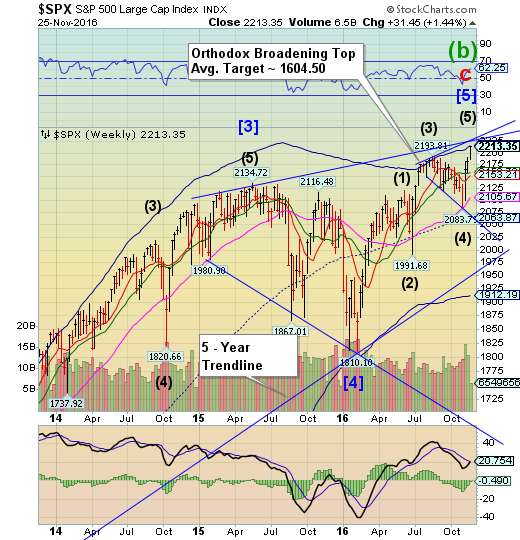
SPX rallied to challenge its Cycle Top Resistance at 2215.55 and slightly exceeded its Fibonacci 61.8% measure of Wave (3) at 2208.67. It may venture higher next week, but either the Cycle Top resistance or trendline resistance at 2225.00 may prevail. Point 5 of the Broadening Topmay be complete or nearly so.
(WSJ) U.S. stocks notched fresh records, capping a week when the Dow Jones Industrial Average breached 19000 for the first time.
It is the third consecutive week of gains for stocks as investors have bet on expectations for reduced corporate taxation and regulation and greater infrastructure spending. Thanks to these past three weeks, the Dow Jones Industrials are on track to end the year with 9.9% gains, which would mark their best annual finish since 2013.
“Nothing is stopping the market at this point,” said Jonathan Corpina, senior managing partner at Meridian Equity Partners.
The NDX rally is blocked by its Cycle Top.
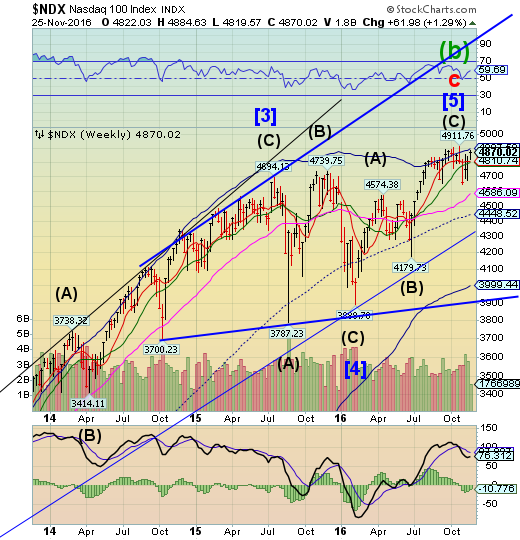
NDX has been unable to better its October 25 high at 4911.76, causing a non-confirmation among the major indices. A decline beneath Intermediate-term support at 4810.74 confirms a new sell signal. It may be imprudent to be long beyond this point.
(ZeroHedge) Another month, and the pain for the hedge fund industry just keeps getting more intense.
According to the latest Evestment report, investors redeemed an estimated net $14.2 billion from hedge funds in October. Year-to-date, there has been a net $77.0 billion removed from the industry. October’s outflow was the fourth month of redemptions in the last five and seventh in 2016. Due to the breadth of products experiencing outflows, and the persistence of redemptions outweighing new allocations, it is clear the industry is experiencing a crisis -like wave of negative investor sentiment.
One almost wonders how much higher the market can keep rising with redemption requests flooding countless back offices. We hope to find out soon.
High Yield Bond Index also falls short of its Cycle Top.
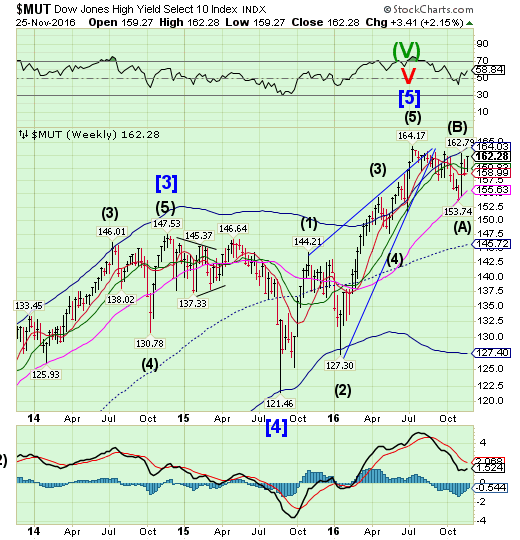
The High Yield Bond Index used its weekly Intermediate-term support at 159.83 as a springboard to challenge its prior high at 162.79. Should it succeed, it may then rally to its Cycle Top resistance at 164.03.A failure at either level may produce a sharp decline to mid-Cycle support at 145.72.
(WSJ) Count the junk bond market among those sending relatively optimistic signs about a Donald Trump administration.
Prices are dropping, and money has been flowing out of high-yield bond funds. But risk premiums haven’t risen, and companies are still issuing bonds—suggesting that a market renowned for picking up early signs of economic stress retains a benign outlook on the U.S. economy.
On Tuesday, Weatherford International PLC sold $540 million of bonds—$40 million more than initially expected. The same day, the oil-field services company was assigned a lowly triple-C rating by Fitch Ratings, a four-notch downgrade from its previous rating.
USB finally ready to bounce?
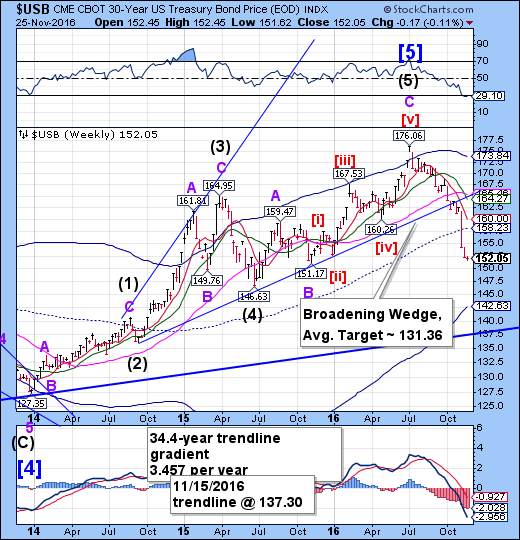
The Long Bond took a breather from its decline this week. There is a high probability of a rally that may last the next three weeks that may challenge weekly mid-Cycle resistance at 158.23.However critical supports have been broken and there is room for more downside to come. A panic may propel USB to its 35-year trendline at 137.30.
(ZeroHedge) The long-end of the US Treasury curve rallied on the week (for the first time since Trump's win) with 30-Year yields ending down almost 3bps, as a last minute panic bid hit stocks and bonds at the early market close; and despite the exuberance in US bank stocks, the yield curve continues to collapse...
At the cash equity close today, bonds and stocks were suddenly both bid... with 30Y back at 3.00%
The Euro retests the Cup with Handle.
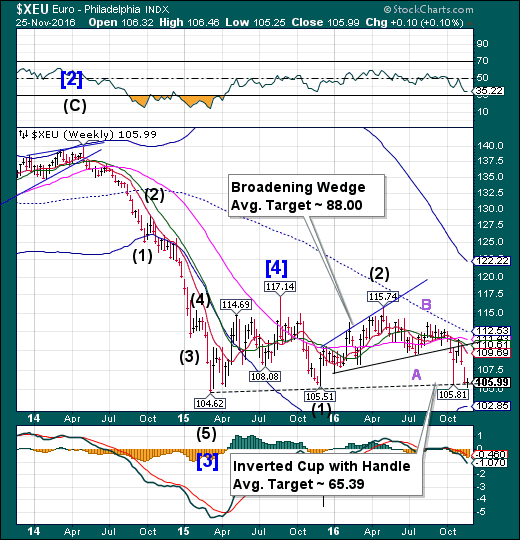
The Euro has been challenging the Lip of its inverted Cup with Handle formation this week. It achieved a probable Master Cycle low on Wednesday and may be due for a three week retracement. Since the Broadening Wedge trendline has already been broken we should expect to see its target coming into view early next year.
(ZeroHedge) A reasonable question that many Europeans might ask would be whether it is not perhaps time to review priorities?
Perhaps the time has come to look at whether it remains worth it, in terms of the potential loss of human life, to remain party to the 1961 Convention, which would prohibit a country from stripping a returning ISIS fighter of his citizenship in order to prevent him from entering the country?
The terrorist as poor, traumatized victim who needs help seems to be a recurring theme among European politicians. But what about the rights of the poor, traumatized citizens who elected these politicians?
Euro Stoxx 50 has another inside week.
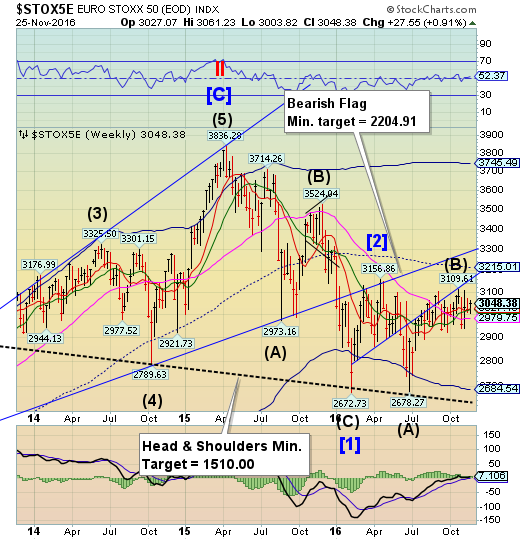
The Euro Stoxx 50 Index bounced from its Intermediate-term support at 3019.79, but only managed to make another inside week.The Cycles Model suggests the period of relative strength may end next week. The Index may have been able to resist making a sell signal so far, but that may change should that support be violated with new lows.
(Bloomberg) European shares closed at a one-month high, capping their longest streak of weekly gains since July.
The Stoxx Europe 600 Index rose 0.2 percent at the close, taking its advance for the week to 0.9 percent. The number of its shares changing hands was about 40 percent lower than the 30-day average, with U.S. markets closing early following yesterday’s Thanksgiving holiday. Actelion Ltd (SIX:ATLN). led a rally in health-care shares, surging 18 percent after confirming that Johnson & Johnson (NYSE:JNJ) has approached the Swiss drug maker about a potential takeover.
European shares have rebounded 4.2 percent from a low on Nov. 4 on bets that Donald Trump’s administration will lead to increased infrastructure spending. A related rally in copper prices pushed European miners to their highest prices since June 2015 on Thursday. While the Stoxx 600 has been trading in a tight range, its longer-term average level is getting close to crossing above its shorter-term mean.
The Yen completes a long retracement.
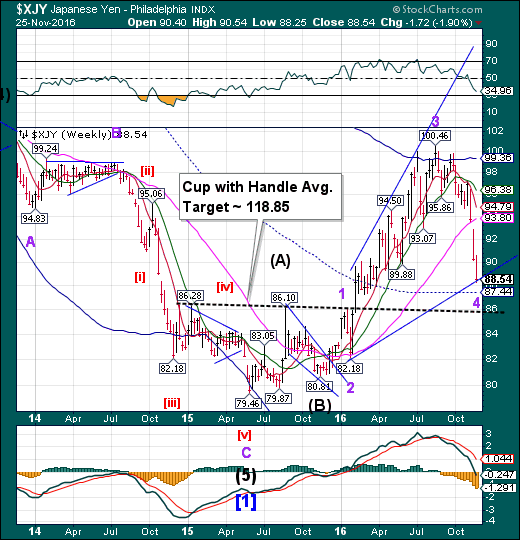
The Yen may have completed its longest decline in two years after three weeks of solid declines. The expected turn in the Yen may have finally arrived today, about two weeks later than indicated by the Model. We may see up to four weeks of Cyclical strength ahead.The decline does not negate the Cup with Handle formation.
(Bloomberg) The dollar posted its biggest three-week gain versus the yen since 1995 as traders view a U.S. interest-rate increase next month as a certainty.
The greenback has surged about 10 percent since Nov. 4 to an eight-month high against the Japanese currency. Expectations that President-elect Donald Trump will implement policies to spur inflation and growth drove U.S. Treasury yields to their highest in a year, underpinning demand for the dollar and strengthening the case for the Federal Reserve to raise interest rates. Minutes of the central bank’s November meeting this week showed officials said the labor market has tightened, with some indicating a rate hike should happen in December.
The Nikkei 225 rallies to new retracement highs.
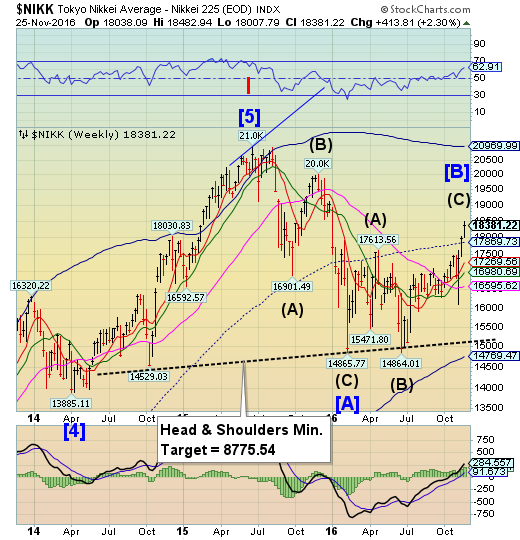
The Nikkei rallied to a new retracement high after breaking through mid-cycle resistance last week nearly reaching a 60% retracement of the 2015 decline.It appears to have a few more days of Cyclical strength in which it may meet its 61.8% Fibonacci retracement. However, the reversal may be sharp and without warning. Should the Head & Shoulders neckline be broken, a panic decline may ensue.
(Reuters) Japan's Nikkei share average rose for a seventh straight session on Friday after U.S. shares soared and the dollar jumped further against the yen, lifting prospects for better corporate earnings.
The Nikkei rose 0.6 percent to 18,438.97 points by mid morning, extending its longest winning streak since November 2015.
For the week, the benchmark index is poised to rise 2.8 percent.
US Dollar Index reaches its Cycle Top.
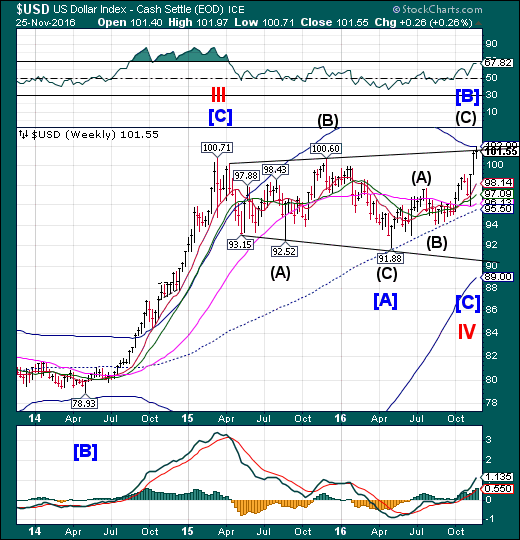
USD rallied toward its cycle Top resistance at 102.00, reaching 101.97 before reversing today. Current support is at 100.60. A decline beneath that level may cause a rapid move from bullish to bearish as traders find themselves wrong-footed.
(ZeroHedge) Having soared to fresh 13 year highs in a quiet overnight session on thin liquidity due to the US Thanksgiving holiday, which sent the USD/JPY just shy of 114 and the Yuan to 6.96, the dollar pared back its weekly advance with modest profit taking after traders wondered if the rally has gotten "too stretched."
…Expectations of rises in U.S. inflation and interest rates have driven the greenback to a gain of more than 6 percent in October and November combined, its strongest performance over a similar period since its rally in early 2015. Most investors expect those gains to continue, but a combination of the Thanksgiving break in the United States, market participants' need to process corporate flows at the end of the month and a raft of risks in the first half of December all speak for cashing in some of those gains now.
Gold declines to its Broadening Top trendline.
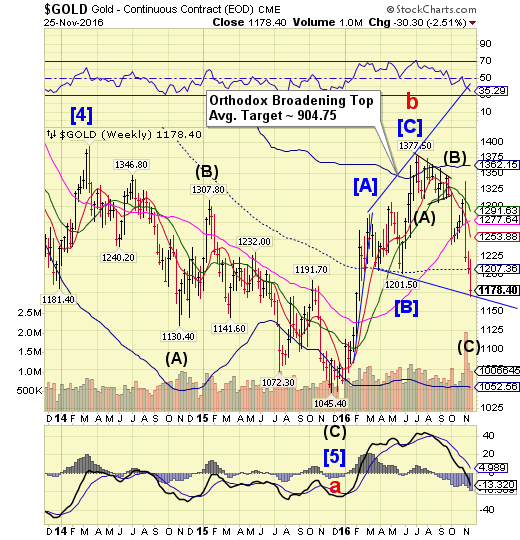
Gold declined to the lower trendline of its Orthodox Broadening Top formation. However, the decline may not be over, yet.The Cycles Model suggests possibly another two weeks of decline, which agrees with the Broadening Top pattern which calls for a continued decline to the vicinity of 1150.00.Nonetheless, it may be time to be on guard for a reversal pattern
(Bloomberg) Gold pared a third weekly drop as the dollar halted a rally that sent bullion prices to a nine-month low and pushed silver into a bear market.
Bullion’s first gain in four days cut this week’s loss to 2 percent. Prices have tumbled as strong economic data and the prospect of more spending after Donald Trump’s U.S. election win boosted bets for higher interest rates. Investors are selling out of gold-backed funds at the fastest pace in three years.
The metal rebounded on Friday as the Bloomberg Dollar Spot Index retreated from a recent high. Gold’s decline earlier stalled at $1,171.18 an ounce, which is near a 61.8 percent retracement of the rally from December to July. The Fibonacci figure is used by some traders and analysts to determine support levels.
Crude Oil retraces to mid-Cycle resistance.
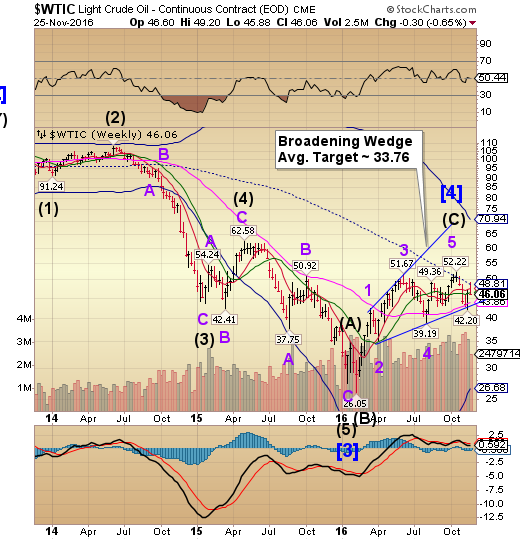
Crude bounced from its Intermediate-term support at 46.06 to challenge mid-Cycle resistance at 48.81, where it peaked on Wednesday.The cycles Model suggests a decline may be imminent, while a significant low may be reached in approximately 3 weeks.There is now the probability of a decline that may test the February low. After 6 months of being range-bound, traders may not have seen this decline coming.
(Reuters) U.S. crude fell nearly 4 percent on Friday, dragged down by uncertainty over whether the Organization of the Petroleum Exporting Countries will reach an output deal, after Saudi Arabia said it will not attend talks on Monday with non-OPEC producers to discuss supply cuts.
Brent crude futures settled at $47.24 a barrel, down $1.76 or 3.59 percent. U.S. crude futures settled down $1.90 a barrel at $46.06, a 3.96 percent decline. Prices continued to decline in post-settlement trading, dropping as low as $45.88 a barrel.
Shanghai Composite challenges mid-Cycle resistance.
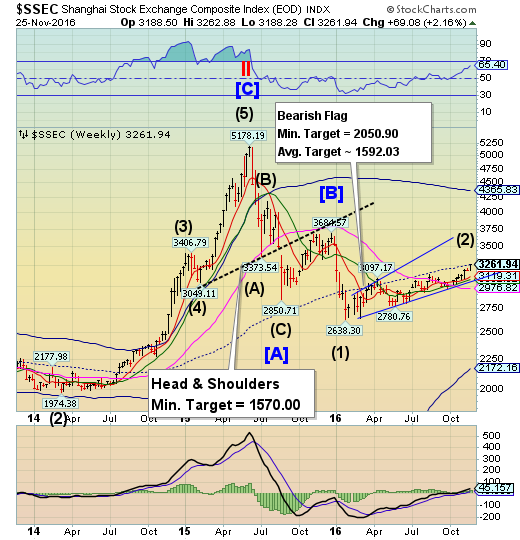
The Shanghai Index challenged mid-Cycle resistance at 3269.00 today, making nearly a 60% retracement of its early 2016 decline.Its cyclical strength is waning and a reversal from this resistance may lead to an inevitable breakdown.The fractal Model suggests the Shanghai is due for another 1,000 point drop, possibly starting next week. The next Master Cycle low may be due in early January.
(ZeroHedge) Over the weekend we reported that as Obama was speaking at the APEC summit in Peru, hoping to salvage his global trade legacy, the TPP, China's President Xi Jinping officially called for the launch of the Free Trade Area of Asia-Pacific for "institutional guarantee of open economy", a move many had expected would take place as China was eager to fill in the void left by the US in any trans-Pacific trade treaty.As we previously reported, in his speech in Lima, Xi Jinping sought to position himself as a leader in global commerce, vowing to support trade. The attendees signaled “deepening economic integration and opposing trade protectionism,” the Foreign Ministry spokesman said on Tuesday.Then, overnight, China got a present when Trump announced in a brief video statement that his first executive order upon becoming president would be to remove the US from the TPP. That's all Beijing needed to hear and this morning China said it hoped to conclude an Asia-wide trade pact as soon as possible, in what the WSJ dubbed was "a sign of Beijing’s intent to broaden its regional influence amid the apparent collapse of the U.S.-backed Trans-Pacific Partnership."
The Banking Index reaches the trendline of its Orthodox Broadening Top.
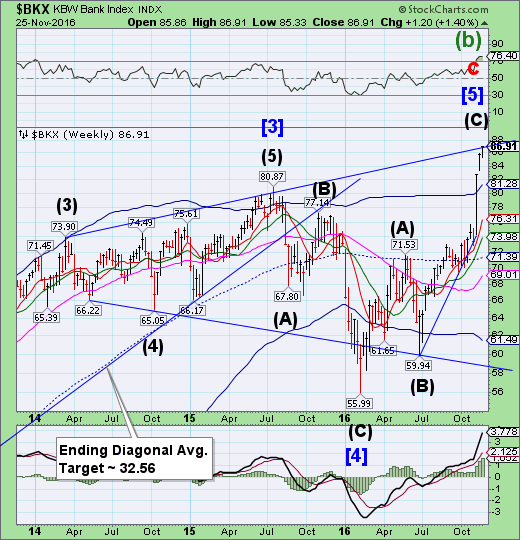
BKX surged to the upper trendline of its Orthodox Broadening Top at 87.00 today.This may well be the terminal push as the Cycles Model suggests the period of strength ends on Monday. Once broken, we may expect this three-year pattern to unwind very quickly.
(BBC) Shares in US banks have surged since Donald Trump won the US election. It is in expectation of the president-elect's proposed bonfire of what he believes are rules and regulations that hamper business.
But in banking, many of those rules were put in place after the last financial crisis in the hope of preventing a future meltdown.
Now Neel Kashkari, president of the Federal Reserve Bank of Minneapolis is proposing an alternative that may be more in line with Donald Trump's way of thinking.
He believes that banks should be forced to massively increase their capital reserves - the amount of cash they are obliged to keep in hand for the day when everything goes wrong at once.
(ZeroHedge) The long-end of the US Treasury curve rallied on the week (for the first time since Trump's win) with 30Y yields ending down almost 3bps, as a last minute panic bid hit stocks and bonds at the early market close; and despite the exuberance in US bank stocks, the yield curve continues to collapse...
At the cash equity close today, bonds and stocks were suddenly both bid... with 30Y back at 3.00%
(ZeroHedge) Back in the summer we wrote about an IMF report that flagged Deutsche Bank (DE:DBKGn) as the "most important net contributor to systemic risks" . Those who read our site frequently were likely not terribly surprised by the IMF's conclusion.
Among the G-SIBs, Deutsche Bank appears to be the most important net contributor to systemic risks, followed by HSBC and Credit Suisse (SIX:CSGN). In turn, Commerzbank (DE:CBKG), while an important player in Germany, does not appear to be a contributor to systemic risks globally. In general, Commerzbank tends to be the recipient of inward spillover from U.S. and European G-SIBs. The relative importance of Deutsche Bank underscores the importance of risk management, intense supervision of G-SIBs and the close monitoring of their cross-border exposures, as well as rapidly completing capacity to implement the new resolution regime.
That said, we suspect the latest ranking of global systemically important banks (G-SIBs) by the Financial Stability Board may be a bit more surprising to our readers, among others, as it features two of America's largest banks right at the very top.
(ZeroHedge) If everything is so awesome, with a growth/inflation miracle just around the corner, then why is the US treasury yield curve collapsing in a dismal-growth-outlook-implying manner?
Following the knee jerk spike on the election, 5s30s have crashed to 6 week lows...
Nowhere is this decoupling from reality narrative more obvious than in the banks as NIM is a spread not an absolute...
And, as we asked last night, if bank stocks are so great and bank business looks so shiny... why is bank credit risk now at its highest in a month?
