by Eli Wright
Markets were subdued and range-bound last week, as both trading volume and volatility fell. Italy’s efforts to come up with a viable bank bailout program, beginning with the country's most at-risk financial institution Monte dei Paschi (MI:BMPS), lent some excitement to the week, as did oil prices closing at 17-month highs.
Here’s how events played out:
Markets take an early holiday break
Early in the week, the Dow came within 13 points of the 20K benchmark, but as holiday volume slowed, there were no new all-time-high fireworks. The Dow ended the week up 0.5% at 19,933.81 – its seventh straight week of gains, while the NASDAQ and S&P rose 0.5% and 0.24% on the week, respectively.
On Friday, the Dow traded in a range of just 35.1 points – its tightest range in three years, with trading volume at only 3.98 billion shares exchanged – the lowest figure since December, 2014.
Asian markets closed lower on the week, except for the Nikkei which was closed for the Emperor's Birthday holiday. The Shanghai Composite closed down 0.4% for the week while the Hang Seng closed down 2% for the same time period.
European markets all closed marginally higher for the week: the FTSE ended up 0.8%, near its 52-week high while the DAX was up 0.4% on the week. France's CAC 40 was up 0.13%.
Italy’s bank bailout begins
Newly installed Italian Prime Minister Paolo Gentiloni said his government had approved a $21 billion fund to prop up Italy’s struggling banking sector, which is currently grappling with over $200 billion in bad debt, pending EU approval.
Monte dei Paschi, the nation’s third-largest bank, which failed a pivotal stress test in July, announced earlier in the week that they had failed to raise $5 billion in much-needed capital from private investors, and revealed it could run out of funds as early as April, 2017. It became the first bank to request state aid.
A state bailout would in conformance to EU rules, force many of the bank’s bondholders to convert their investments into shares. The government has said they would compensate some investors, however analysts warn that a failure to do so could weaken the Italian banking sector if savers rush to withdraw their cash. Banking problems in Italy would likely extend to the rest of the EU. Italy’s political future could depend on how this deal is swallowed by the general public, as well as whether or not this bailout will be a one-time occurrence.
Another major concern is the fact that this banking-sector bailout will further diminish the Italy’s fiscal outlook. It already has a debt-to-GDP ratio of 133%, the second-highest in the EU after Greece. Following the massive Greek financial crisis in 2015, nobody wants to repeat that ordeal in Italy.
On Thursday, the US Justice Department fined Deutsche Bank (NYSE:DB) and Credit Suisse (NYSE:CS), $7.2 billion and $5.3 billion, respectively for selling toxic mortgage securities ahead of the 2008 market crash. Outstanding probes continue against two additional major eurozone banks: the UK's Royal Bank of Scotland (LON:RBS) and Switzerland's UBS (NYSE:UBS).
Oil finishes week on a high note
Oil futures closed at their highest level since July, 2015, ending the week at $53.23. Brent was up to $55.90.
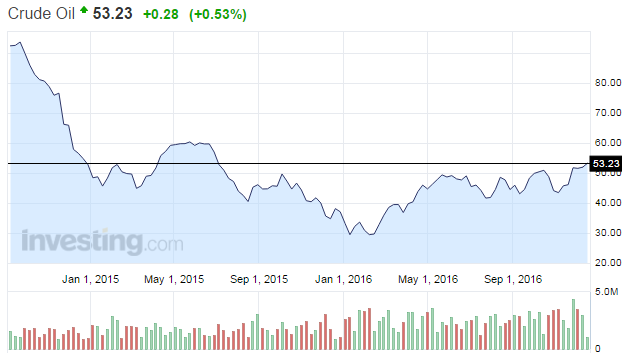
Despite OPEC output in November coming in at a record 34.2 million barrels per day—300,000 bpd more than October production levels—the cartel's deal, in conjunction with 11 non-OPEC nations, to cut production by 2 million bpd, has, thus far, been fully embraced by the market. The test will come in January when the freeze deal is set to commence, at which point markets will learn if the promised cuts will actually be adhered to.
Last Week’s Biggest Gainers
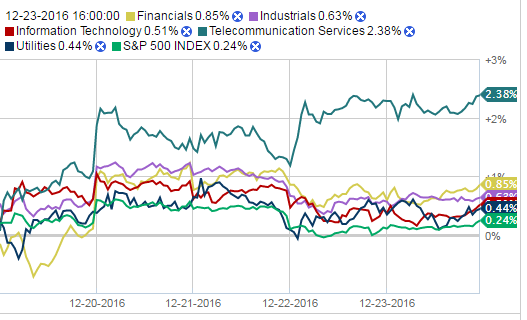
Telecom, Financials, and Industrials led the S&P 500 last week, outperforming the benchmark index with individual sector gains of 2.38%, 0.85%, 0.63%, respectively. Overall the S&P gained approximately 0.24%.
Source: Fidelity.com
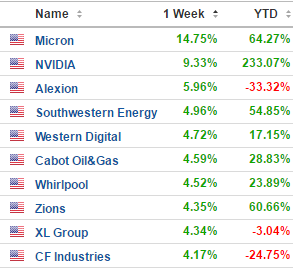
It was, however, the technology sector, that held the position of top weekly gainer among last week's 10 best performing stocks. After reporting Q1 2017 earnings, shares of Micron (NASDAQ:MU) jumped 15.5%. The gain was attributed to an increase in the price of memory chips as well as a growing need for those chips in a wider array of categories.
As Barclays analyst Blaine Curtis wrote in a note, quoted in Fortune.com:
“We continue to see signs of an overall healthier memory environment that can translate to sustained profitability for (Micron) and the industry as a whole.”
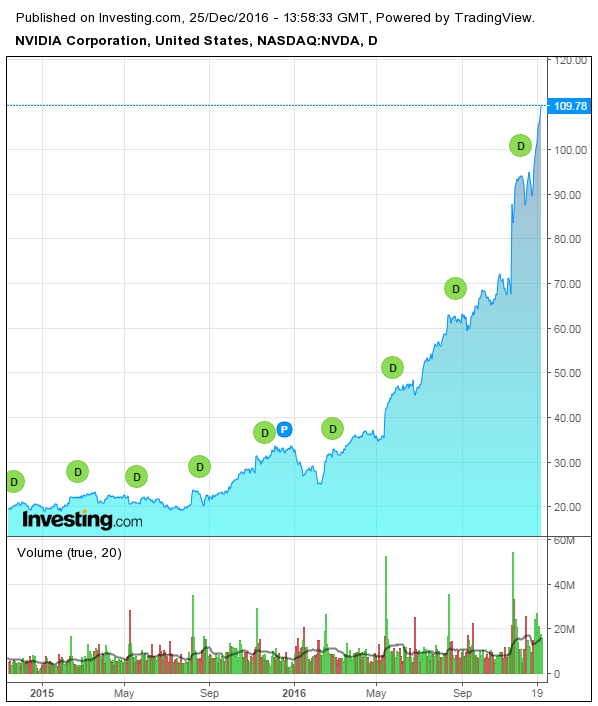
The sector as a whole also saw upward momentum, as included in the top five weekly gainers were two more memory/chip makers: NVIDIA (NASDAQ:NVDA) gained a further 9.3% – it’s now up 233% YTD; and Western Digital (NASDAQ:WDC) rose 4.72%.
Two energy companies, Southwestern (NYSE:SWN) and Cabot Oil & Gas (NYSE:COG), were boosted by higher oil and natural gas prices, up 4.96% and 4.59%, respectively.
Alexion Pharmaceuticals (NASDAQ:ALXN) (+5.96%), Whirlpool (NYSE:WHR) (+4.52), Zions Bancorp (NASDAQ:ZION) (+4.35), insurer XL Group (NYSE:XL) (+4.34), and CF Industries, a manufacturer of fertilizers and other nitrogen products (NYSE:CF) (+4.17%), rounded out last week's top ten.
Last Week’s Biggest Losers
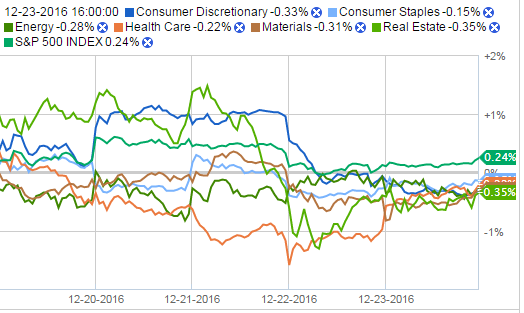
The Energy, Health Care, and Real Estate industries lagged the overall S&P, with companies in those sectors declining 0.28%, 0.22%, and 0.35%, respectively.
Source: Fidelity.com
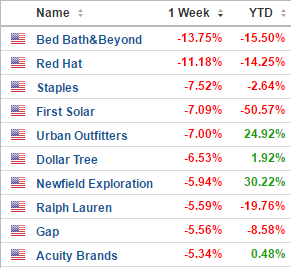
The Consumer Discretionary index was also lower, down 0.33% on the week. Indeed, a variety of retailers and apparel companies made up the majority of weekly losers: Bed Bath & Beyond (NASDAQ:BBBY) dropped 13.75%; Staples (NASDAQ:SPLS) fell 7.52%; Urban Outfitters (NASDAQ:URBN) and Dollar Tree (NASDAQ:DLTR) each lost 7%; and Ralph Lauren (NYSE:RL) and Gap (NYSE:GPS) both declined 5.6%.
Software company Red Hat (NYSE:RHT) (-11.18%), alt-energy First Solar (NASDAQ:FSLR) (-7.09%), oil and gas E&P stock Newfield Exploration (NYSE:NFX) (-5.94), and lighting solutions and services company Acuity Brands (NYSE:AYI) (-5.34%) round out the list.
What to expect this coming week
With most developed world markets closed on Monday, and some closed on Tuesday as well for an extended Christmas break, and with many traders still on vacation ahead of the New Year, expect light, range-bound trading to continue into the holiday shortened week.
Though the Economic Calendar is relatively light this coming week, the US releases Consumer Confidence figures on Tuesday, Pending Home Sales numbers on Wednesday, and Crude Oil Inventories on Thursday. Japan's industrial production figures will also be released, as will the UK's BBA Mortgage Approvals and Nationwide housing prices.
