- Rates, trade and Mideast pressure stocks
- 90% beats on already reported earnings buoy stocks
- Lowest unemployment in 18 years, combined with a subdued wage growth boosts stocks on Friday
- Buffet's $75M Apple share purchase rallies equities to close the week
- Equities see best performance in 4 weeks on Friday, but major indices decline weekly
- Investors would borrow less, thereby purchasing fewer stocks,
- Companies would invest and expand less, leading to
- An overall economic slowdown
After the Dow's dramatic recovery on Thursday, in which the mega cap index erased a nearly a 400-point loss, followed by Friday's best performance for US stocks in nearly four weeks—with the Dow gaining 1.39%, the S&P 500 moving higher by 1.28% and the NASDAQ Composite jumping 1.71 percent—should investors now expect a resumption of ongoing rallies? Will stocks resume their relentless uptrend by posting higher troughs in order to take on the January records (March, for the NASDAQ Composite)?
We wish we had a decisive answer. Nevertheless, we do have evidence-based arguments, below. We've split them into negative and positive drivers so readers can reach their own conclusions:
3 Negative Market Drivers
Higher Rates
As a reminder, equity market trouble started when Treasury yields reached a 4-year high with the 10-year yield hovering around 3%. These worries were recently exacerbated by the Fed's signal during last week's FOMC Statement, that the central bank is planning to stay the course for a total of 3 rate hikes this year. This increased concerns that higher rates would, of course, lead to higher borrowing costs, which would slow growth on several levels:
Investors immediately took profits, while speculators shorted, leading to the first double-digit correction for equity market since December 2015-February 2016. Ironically, both then and now, drawdowns were about 12 percent.
However, before jumping back into stocks on the belief that the 57 percent gains which followed the last 12 percent correction might be up ahead, continue reading.
Trade War Fears
Also gnawing at investors has been the looming and apparently escalating possibility of a trade war between the world's two largest economies the US and China. Economists, analysts and politicians have continually warned that hostilities on this front would slow down economic growth and could even lead to an outright recession.
After US President Donald Trump's 2016 election victory, we were shocked to see the market's animal spirits charging so aggressively on Trump's pro-business plans for infrastructure investment, tax cuts and a regulatory rollback while at the same time disregarding his protectionist agenda, which investors themselves had characterized as a market killer.
Still, risk-on appetite was reawakened. Investors added nearly 60 percent to the market since then, until they suddenly were stopped short on the full scope of Trump's MAGA policies when talk of trade tariffs started surfacing from the administration. Does that mean that prices were artificially inflated by misplaced exuberance focused on only a partial consideration of what the Trump trade would engender? Will prices now plummet back down to pre-election victory levels?
Mideast Tensions
Mideast tensions that could break into war are a third significant risk. Not to sound apocalyptic, but theoretically, a Mideast conflict could erupt, then flare up into a global war. And right now there are two main Mideast conflicts brewing.
One, the long-running civil war in Syria, which has become a vassal state of Russia. When Israel or the US and its allies attack Syria, there's always the risk that Russia may retaliate. Plus, during all previous geopolitical events of this nature, China and Russia have always been on the same side. When the US and China are escalating tensions via trade, the strain could easily overflow into a US-Russia conflict on this front as well (especially since Russia also sees itself in a sort of a trade war with the US, afterTrump signed the recent Russia sanctions bill). Ratcheting up the risk here is Iran, a close Russian ally in the region and loyal to Shiite Islam, while their Sunni enemies led by Saudi Arabia are allies of the US, as is Israel.
The second Mideast flashpoint is a possible nuclear arms race between Iran and Saudi Arabia. The latter has been pressuring President Trump not to pull out of Obama's nuclear deal with Iran, which waived sanctions against Iran in exchange for the Ayatollah-led country not developing nuclear weapons. The Saudis do not trust that Iran has honored their obligation not to develop nuclear weapons and believes instead that additional sanctions should be imposed on Iran. If the Trump administration decides to end the current deal by the May 12 deadline, the Saudis are convinced Iran would openly and without hindrance continue nuclear weapons development. Should that happen the Desert Kingdom is threatening to increase their own stockpile of nuclear weapons as well.
It's not hard to see how this highly volatile tinderbox of conflicting interests could potentially become a regional or even global conflict.
2 Positive Market Drivers
Growing US Economy
This past Friday's nonfarm payrolls release showed that in April, jobs increased by 164,000 versus 192,000 expected. For all the criticism of the tepid growth, the economy has till been chugging away. To date it's produced a record 91 straight months of job growth, to reach the lowest unemployment rate since 2000, 3.9 percent.
On the other hand, economists remained perplexed as to why wage growth hasn't matched employment growth. Friday's NFP release revealed that hourly earnings increased by 2.6 percent in the past year, just a bit ahead of inflation. Ironically, though wage growth boosts the economy because it triggers increased spending, stocks rallied on Friday in part on the relief that wage growth was muted, since that could have accelerated the Fed's rate hike schedule.
It's (Still) All About Earnings
Of the 409 S&P 500 companies that have already reported earnings for the first quarter, 89.2 percent beat estimates. That's significantly above the longer-term average of 64 percent, according to Thomson Reuters.
As long as companies keep meeting or beating expectations when they report, investors will likely continue to be pleased with their potential for increased profits per share. As we've often pointed out, since the mid-2016 Brexit vote and the realization by investors that even after the surprising result the sky hadn't fallen, markets have increasingly disregarded risk and instead remained more and more focused on earnings.
Last Week's Market Internals
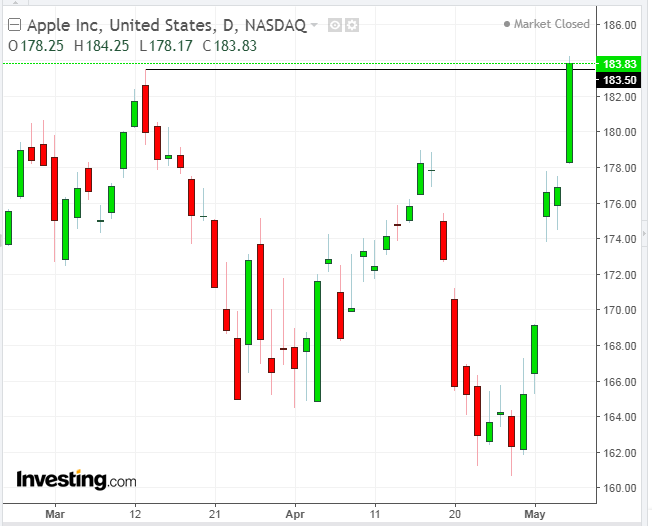
Thursday's spectacular rebound was led by Apple (NASDAQ:AAPL). The computer and smartphone tech giant jumped nearly four percent to close at a record high price per share after news broke that Warren Buffet's Berkshire Hathaway (NYSE:BRKa) bought 75 million shares of the company in the first quarter.
Technically the price escaped a bearish falling channel, advancing 0.18 percent since the former, March 13 peak of 183.50, creating an invitation to a bull-trap.
While Friday was the best day for stocks in nearly four weeks, on a weekly basis the Dow and S&P 500 each fell about 0.25 percent (though the NASDAQ Composite rose +1.24 percent and the Russell 2000 moved higher by +0.64).
Is Friday's bullishness meaningful if, on a weekly basis, the primary benchmark retreated? There is an argument to be made in favor.
After all, a Friday close is the marker that most effectively projects investor commitment or lack thereof. A higher close ahead of the weekend signals investors are willing to remain exposed until Monday's open.
Also in question: can the technology sector and small caps prop up the broader market indefinitely? In fact, the rise of small caps only serves to underscore that trade war jitters are weighing on large caps.
Bottom Line
Should the tiff escalate, selloffs are likely to resume. Also, it could increase Mideast tensions, as the US and China back different sides of the conflicts.
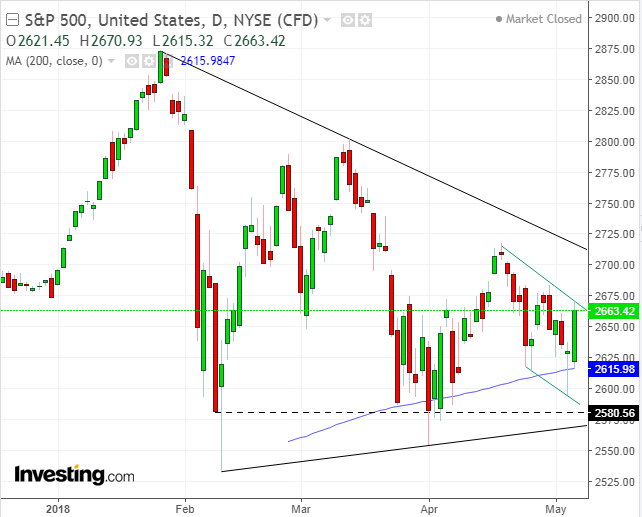
Both the S&P 500 and Dow dipped below and closed above the 200 DMA on Thursday, confirming the importance of this technical level. As prices approach the apex of a triangle pattern, they consolidate more tightly, like a coil before it springs.
The only question is in which direction. Whichever direction, it's likely to determine the next significant market move.
Week Ahead
All times listed are EDT
Sunday
19:50: Japan – BoJ Meeting Minutes: Japan's central bank could shock markets by tightening, as Shinzo Abe's political woes may lead to a resignation. Such a course could be followed by a rejection of Abenomics, which includes QE.
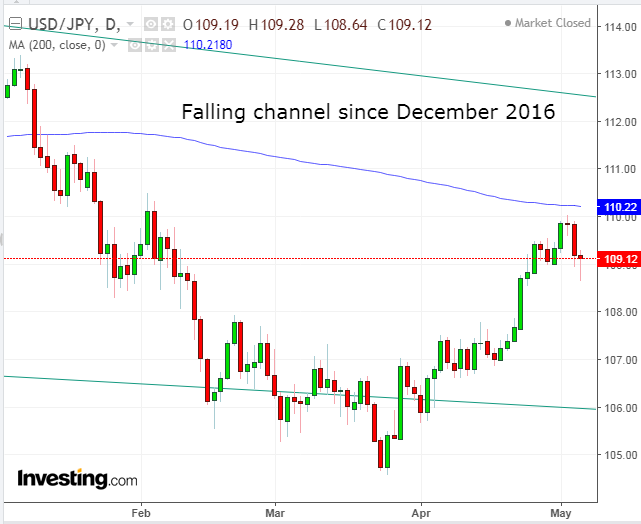
Even with an outlook for an ever-growing positive interest rate differential in favor of the dollar in the long term, the USD/JPY pair has been trading within a falling channel since December 2016. If the BoJ would, in fact, surprise the market and begin tightening, the yen could soar, while Japan's Nikkei 225 and broader TOPIX indices would be weighed down by the stronger local currency.
Monday
UK: Early May Bank Holiday
23:00 (Tentative): China – Trade Balance (April): April’s $5 billion deficit expected to change to a $35 billion surplus.
During a trade spat this data gets extra attention. In this regard, Warren Buffet doesn't believe that the US and China would do 'something extremely foolish.' He's a man who puts his money where his mouth is and as signaled by his Apple shares purchase, he remains bullish on the US equity outlook. It should be noted, however, that Buffet buys stocks for the very long term. He doesn't care about a correction that might last just a couple of years.
Tuesday
2:00: Germany – German Trade Balance (March): surplus expected to widen to €24.5 billion from €18.4 billion.
Although the market narrative is focused on the US-China trade war, Germany—as Europe's biggest exporter to the US—is scared of entering the same battlefield. Therefore, Germany is advocating EU members compromise on trade with the US, something that is putting it at odds with France, which already resents Germany's big trade surplus. This makes Paris dig in its heels more deeply on a tougher EU posture against US tariffs.
3:15: US – Fed Chair Powell Speaks: Watch the US Dollar Index and USD pairs during and after the speech.
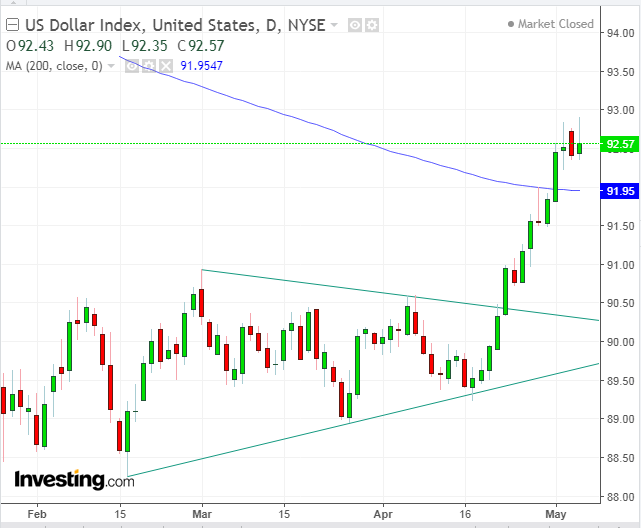
After completing an Ascending Triangle, which may have been a bottom, the Dollar Index crossed above the 200 DMA for the first time since it crashed in December 2016. While this is bullish move, it would need to overcome Friday's bearish shooting star that followed a Bearish Engulfing pattern, that followed a High Wave Candle, three consecutive bearish patterns. A break above 93.00 would clear out all the shorts produced by this price action.
10:00: US – JOLTs Job Openings (March): Expected to decline to 6.020M from 6.052M.
16:30: US – API Weekly Crude Oil Stock: the previous read was 4.427M barrels.
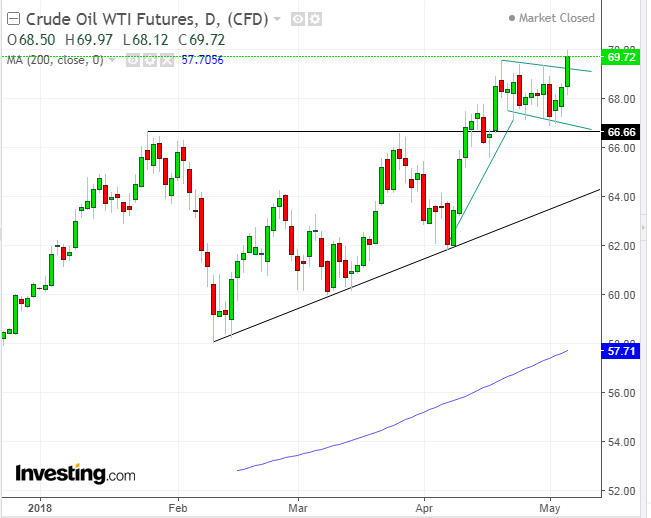
This past week, oil neared $70 per battle, its highest since November 2014, even as stockpiles have recently been mounting. Investors are on edge over whether Trump will sign the waiver on Iran sanctions.
Wednesday
8:30: US – PPI (April): expected to rise to 0.3% MoM and core PPI to rise 0.2% MoM from 0.3%.
10:30: US – EIA Oil Inventories (w/e 4 May): stockpiles expected to rise by 160,000 barrels.
Oil's price provided an upside breakout to a bullish Falling Flag on Friday, and an implied $78 target.
21:30: China – CPI (April): forecast to be 2% YoY from 2.1% and 0.1% MoM from -1.1%.
Thursday
4:30: UK – Trade Balance (March): expected to see deficit increase to £2.9 billion from £0.9 billion.
4:30: UK – Manufacturing Production (March): Expected to remain flat at 0.2 percent MoM and to rise to 2.9 percent from 2.5 percent YoY.
7:00: UK – BoE Rate Decision: the central bank is expected to leave rates at 0.5%, after Mark Carney's recent comments changed market expectations. No change expected on the QE program.
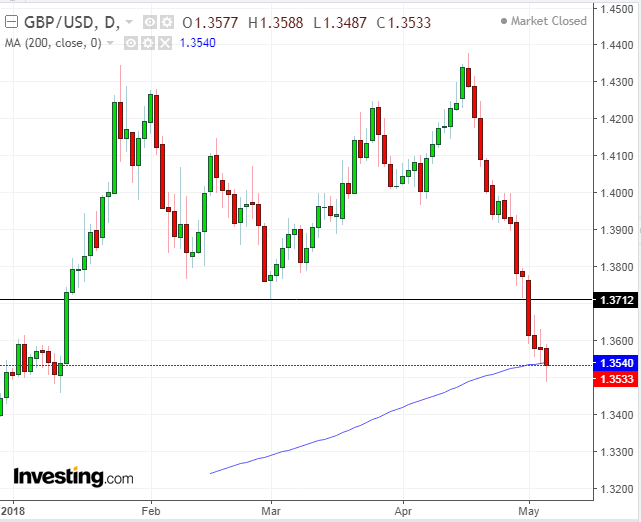
The pound completed a double top last Tuesday and, until Friday, had been falling for eight straight days. So far, it has found support at the 200 DMA, closing above it after dipping below it. The target of the implied double-top is 1.3100.
8:30: US – CPI (April): inflation to rise 0.1% MoM from 0%, and 2.1% YoY from 2.4%, while core CPI rises 2% YoY from 2.1%
Friday
8:30: Canada – Employment Data (April): expected to see 13,500 jobs created from 32,300 a month earlier. Unemployment rate to remain at 5.8%.
10:00: US – Michigan Consumer Confidence (May): forecast to rise to 99 from 98.8.

