Apple (NASDAQ:AAPL) just reported earnings and its results demonstrate that the company can grow even without double-digit smartphone growth. The company – whose growth relies 60 percent on iPhones – is successfully selling more services, such as Pay to its premium subscribers. All told, services revenue accounted for a record $92 billion last quarter, or a whopping 31 percent of growth.
The company seems to be attempting to be more than just an iPhone maker as they continue to sell a growing list of services that are designed to integrate with their Apple devices. Last year the company sold 217 million iPhones, over 40 million iPads and nearly 20 million Macs. That translates into a lot of users to whom to sell the integrated services.
Apple beat earnings expectations, with a $2.73 EPS vs $2.67 estimated; a $611 billion revenue vs the forecasted $60.82 billion. However, iPhone sales disappointed with only 52.2 million vs a 52.4 million estimate. The fiscal Q3 revenue guidance of $51.5 billion to 53.5 billion is roughly in line with a higher potential, than the $51.61 billion expectation. Net income was $13.82 billion, up from $11.03 billion a year ago. A year ago, Apple earned $2.10 a share on revenue of $52.9 billion.
The stock rallied in after hours trading. It is trading in the pre-market at $173.81, $4.71, or 2.79 percent higher.
A trader attempting to enter a position after an earnings release during the prior day’s after-market must ascertain whether the starting price has more ways to go as traders join the trading in the normal hours, or whether it’s a case of “buy on the rumor, sell on the news.”
That’s what we will attempt to figure out here. We will look at different indications and attempt to reach the bottom line of the evidence.

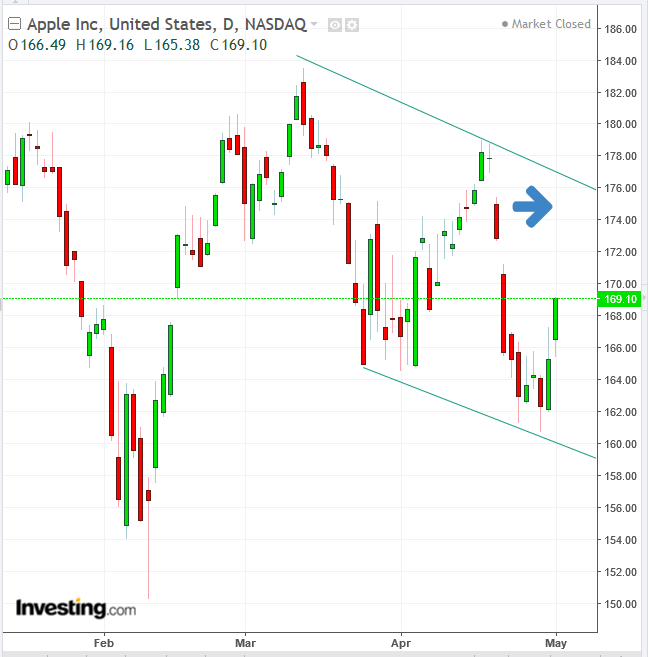
At the current pre-market price (thick black line), the stock is still trapped within a falling channel. For as long as the price is beneath a resistance, it is considered to have a higher probability of remaining below it. On the other hand, should a price decisively break out, the expectation is that it would continue to rally. In our case, the price might not escape the falling channel.
While the volume in the rally of the last couple of days has grown, it is still significantly below that of the April 20 plunge. That may suggest that upside participation is overshadowed by that of the downside.
There are three primary components in technical analysis: price, volume and momentum. While price is the most important one, it is more reliable when supported by volume and momentum. Another way of saying this is that momentum and volume are expected to lead price. Should they not, it is suspected to be a false move.
The Money Flow Index (MFI) oscillator includes price and volume to measure buying and selling pressure. It is like the RSI, with the addition of volume. With both leading components, it is expected to provide an earlier lead.
While the April 26 rally was accompanied with a more pronounced MFI uptick than that of the RSI, the latter beat the MFI by a day, crossing above its previous high on April 30. While each individual indicator provided a bullish signal, experienced traders might wonder why the RSI beat the MFI. The obvious answer is that the MFI incorporates, and therefore also relies on volume, while the RSI is only momentum based. This brings us full circle to the concern that while volume has been rising, it is below that of the April 20 rally.
Finally, the Advance Decline is flat, providing a negative divergence to Apple. In other words, as great as Apple’s results may be, they can’t go alone. When investors go risk off, they tend to sell the good apples with the bad ones.
In this case, the litmus test is whether the price will be able to transcend the falling channel top, or whether it will fall back.
