Tuesday January 2: Five things the markets are talking about
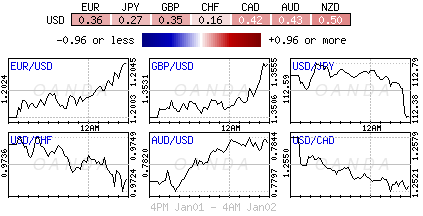
Despite the Fed backing up interest rates three-times in 2017 and starting the unwinding of its QE policy, the ‘mighty’ dollar ended up being the worst performing G10 currency last year (-9.5% vs. against its peers). The theme for the New Year, thus far, has not changed.
A plethora of manufacturing data is today’s main releases (PMI surveys for the U.K, U.S and Eurozone), while the key focus this week will be this Friday’s U.S and Canadian labor market report, where another strong headline rise is expected.
Tomorrow, the Fed will release minutes from its Dec. 12-13 policy meeting, when officials voted to hike short-term interest rates. Two FOMC members opposed the move, and the minutes may show if other participants shared their concerns about weak inflation. Investors will also be keen to know if U.S officials saw the Republican tax overhaul affecting the economy this year and beyond.
Note: The U.S dollar bull believe the tax plan could further support an already-growing U.S economy and push the Fed to hike rates at a faster pace in 2018.
For Friday’s U.S jobs report, the market is not expecting any changes to the U.S jobless rate (+4.1%), and a healthy headline print of +180k new non-farm jobs last month, with average hourly earnings set to rise +0.3% on the month.
1. Global stocks mixed start to 2018
Euro equities is starting the New Year on the back foot, failing to capitalize on a positive Asian session, which was supported by Chinese equities rallying on the back of stronger manufacturing data (China’s Dec. Caixin PMI Manufacturing rallied to its highest level in six-months).
Note: Markets in Japan remain closed until Thursday for holidays.
Down-under, Aussie shares were little changed on its first day of trade in 2018. The S&P/ASX 200 index closed out the year falling -0.4% on the last trading day of 2017, but logged a +7% gain for the year.
In Hong-Kong, stocks rallied the most in three-months to a new decade-high aided by China’s stronger than expected factory activity. The Hang Seng index was up +1.99%, while the Hang Seng China Enterprises index rose +3.07%.
In China, the Shanghai Composite index closed up +1.27%, while the blue-chip CSI300 index was up +1.41%.
In Europe, regional indices have started January on the weak foot with notable weakness in the DAX and the French CAC – a stronger Euro (€1.2064) seems to be putting pressure on indices.
U.S stocks are set to open in the ‘black’ (+0.2%).
Indices: Stoxx600 -0.6% at 386.9, FTSE -0.3% at 7,650, DAX -0.3% at 12,942, CAC 40 % -0.1% at 5, IBEX 35 % at , FTSE MIB % at , SMI % at , S&P 500 Futures +0.2%
2. Oil starts the New Year strong as Iran unrest pushes up prices, gold stronger
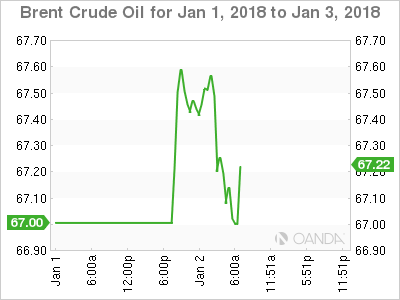
Oil prices have started 2018 by posting their strongest opening in nearly four years, with crude rising amidst anti-government rallies in Iran and ongoing supply cuts led by OPEC and Russia.
Brent crude futures are at +$67.18 a barrel, up +31c, or +0.5%, while U.S West Texas Intermediate (WTI) crude are at +$60.63 a barrel, +21c, or +0.4%.
Despite anti-government protesters continuing to demonstrate in Iran – a major oil exporter – market sentiment remains bullish on the back of falling inventories globally and strong economic growth forecasted.
Note: Oil markets have been supported by a year of production cuts led by OPEC and Russia. The cuts started 12-months ago and are scheduled to cover all of 2018. While in the U.S, commercial crude oil inventories have fallen by almost -20% from their historic highs last March, to +431.9m barrels.
Strong global demand growth, especially from China, has also been supporting crude. A concern for the crude bull should be rising U.S production, which is on the verge of breaking through +10m bpd.
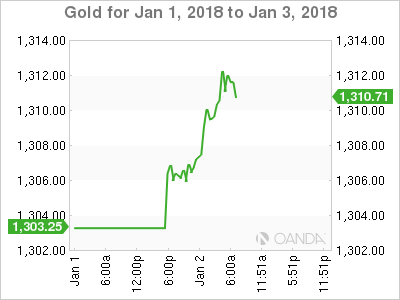
Gold prices (+0.2% to +$1,305 an ounce) have printed a three-month high overnight on strong technicals (closed above its 100-day moving last week) and on the back of a weaker U.S dollar.
Note: CFTC data last week show that investors have raised their net long position in COMEX gold for the second straight week in the week to Dec. 26, and cut their net short position in silver slightly.
3. Yields differentials to dictate shape of sovereign curves
Expect rate differentials to dominate trading in the New Year. In particular, the market will be focusing on the spread between the German 10-Year Bund and U.S Treasury’s – it has tightened to around +200 bps, but many expect the widening trend to resume as regional fundamentals are expected to reassert themselves this year.
The European Central Bank (ECB) is expected to remain one of the most accommodative central banks, given that its inflation target is expected to remain on the ‘softer’ side. If so, it should anchor Bund yields and lead to the German-U.S spread widening.
Note: The fixed income market now pricing in a +68% chance of a Fed March hike and two more hikes for 2018, investors will look to tomorrows FOMC’s minutes for clues to assess how strong U.S policy makers confidence is for any pick-up in inflation.
The yield on U.S 10-year’s has gained +2 bps to +2.43%, while Germany’s 10-year Bund yield has backed up +3bps to +0.46%, the highest in almost three-months. In the U.K, the UK 10-Year Gilt yield has advanced +3 bps to +1.217%, the highest in a week.
4. Dollar starts the New Year at new lows
The ‘mighty’ USD has begun 2018 with fresh broad declines. The U.S Dollar Index is trading atop of its three month lows.
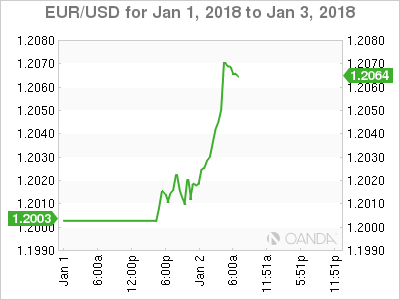
The EUR/USD has added to its post holiday gains by +0.4% at €1.2966. The pair has been rising on expectations that ECB’s QE program would not be extended when the program ends next September – On the weekend, comments from ECB’s Coeure (France) – who noted that he saw a “reasonable chance” that bond buying would not be extended – is supporting the single unit.
Note: The ECB begins 2018 by cutting its monthly bond purchases by half to +€30B.
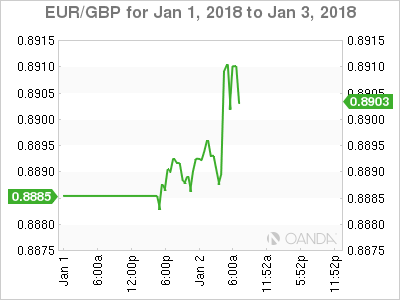
GBP/USD is again making an attempt to encroach on the post-Brexit £1.36 key resistance area. The pound has been supported outright by speculation that PM Theresa May will consider a cabinet reshuffle. Nevertheless, sterling edges lower against the EUR (€0.8909) after data this morning showed that U.K. manufacturing purchasing managers’ index for December dropped to 56.3, below November’s 58.2.
5. Eurozone manufacturing PMI confirmed at record high
Data releases this morning confirmed that PMI’s for the eurozone’s manufacturing sector hit a record high in December, rising to 60.6 from 60.1 in November, in line with expectations.
Digging deeper, last months high confirms how strongly the sector finished a year in which the eurozone economy exceeded expectations.
In addition to the currency area as a whole, there were series highs for Germany, Austria and Ireland, while the French and Greek sectors had their strongest months in a long time.
Strong new order flows suggest that Euro manufacturing will have a positive start to 2018.
