Alphabet (NASDAQ:GOOGL) To Hit $700 Billion Market Cap. Faster Than Apple (NASDAQ:AAPL)
Tech stocks are partying like it’s 1999. While we all hate to say ‘like the old days’, Fridays tech rally is not something we have seen since the days of the 2000 tech bubble. The difference from then to now was the investors were betting on the internet’s potential, but today, tech companies are part of our everyday lives.
The tech heavy Nasdaq gained the most, setting another record, up 2.2% in its biggest one-day point gain since August 2015. Four stocks added $146 billion in market value to the companies, almost the total value of IBM (NYSE:IBM); The Alphabet Inc. (Google +4.26%), Amazon (NASDAQ:AMZN) Inc. (AMNA +13.22%), Microsoft Corp. (NASDAQ:MSFT +6.41%) and Intel Corp (NASDAQ:INTC). (INTEL +7.38%). Chief investment strategist, Michael O’Rourke at Jones Trading Institutional Services said friday ‘It’s the craziest behavior I have seen since early 2000.’ O’Rourke was talking about the 1999-2000 tech bubble, and how fast it took to run the Nasdaq up to 5,000, and over the decade it took to get back up to that level. He went on to say, ‘It can only be described as euphoria.’
These Are Not Our Fathers Markets
I remember the 2000 tech bubble very well. Every day for months some new company that no one had ever heard of was up 50%. It was also the ‘era’ the the stock day trading rooms, where all you have to have was $10,000 or $20,000 to jump on the bandwagon. Everyone was a genius back then. We watched from my S&P 500 desk on the CME floor while the Nasdaq went straight up for weeks, and we all knew it was not going to end well.
There were a lot of comparisons going on at the time to the run up in 1987. Back then there was no cloud like there is today, there was no Facebook (NASDAQ:FB). Back then, IBM was the bellwether of the S&P, but that’s not how it works today. According to FactSet, Google’s third-quarter sales grew to $27.8 billion from $22.25 billion from a year-ago, and pulled in profit of $6.73 billion.
As in the past, Google’s biggest cash windfall was its ad sales, which grew 20% to $19.7 billion, topping analyst expectations by $500 million. There were no companies around back then that had numbers like that. Amazon shares soared 11% Friday morning, adding $55 billion to the e-commerce giant’s market value. Amazon had its biggest one-day gain in more than two years. The internet retailer’s quarterly revenues hit a record, and its cloud-computing unit increased sales by 42% from the previous year.
The shorts got in and the shorts got out
The sellers came back in force on Wednesday when the ES dropped down to 2541.50. Like always, the bull market was over, and a crash was coming. Every time the ES sells off that is the theme, but that’s never the result. We knew it was going to be a big week of economic and earnings reports, and we figured there would be a pickup in volatility, but after Wednesday’s slide and rally, and Thursdays quiet session, it wasn’t until after the bell when Google and Intel reported explosive earnings that things got hot to the upside. The smashing earnings helped push the major indices to new all-time contract highs in one of the biggest stop run we have seen in a long time.
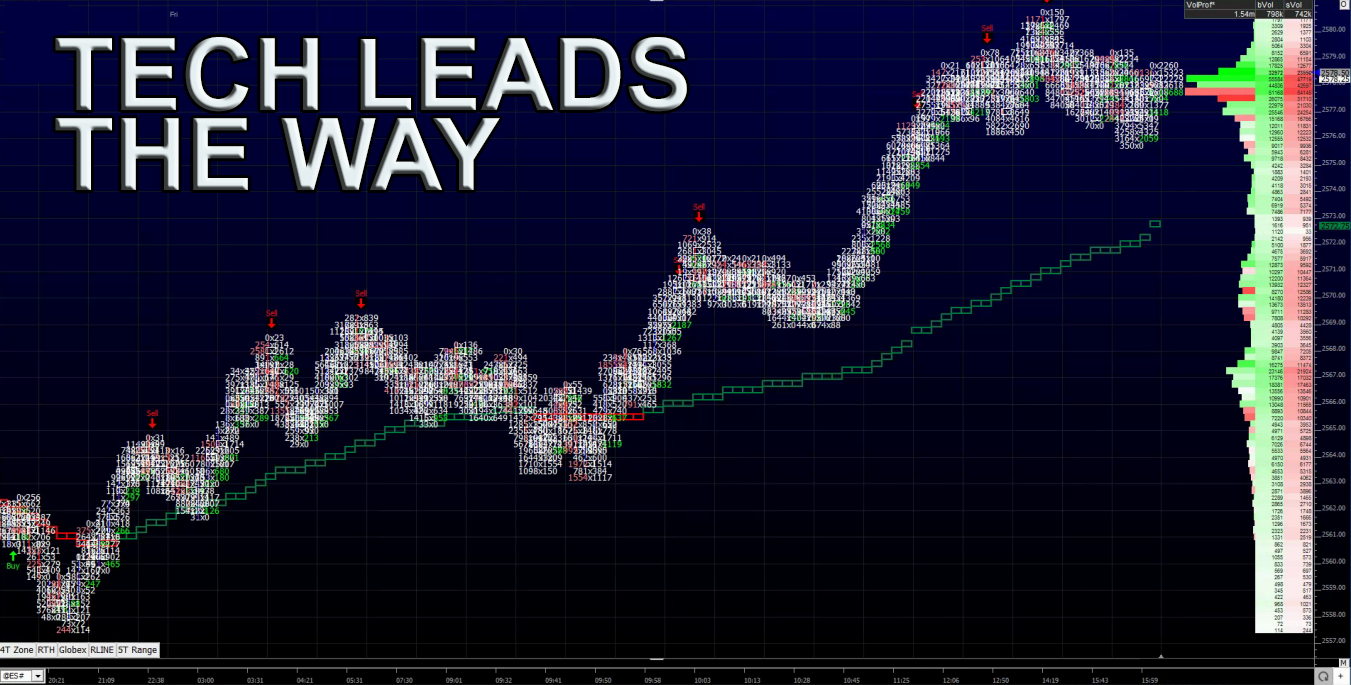
On Fridays 8:30 ct open the (ESZ17:CME) traded 2565.25, up ticked to 2568.25, dropped down to the vwap at 2565.50, rallied back up to 2568.00, and then had two drops under the vwap at 2563.50 where it made its low for the day. After putting in the low, the ES rallied up to 2568.00, pulled back down 1 tick above the vwap at 2556.00, and then shot up to 2572.50 at 9:05. For the next 40 minutes the ES ‘back and filled’ from 2571.50 to 2569.00, where it triple bottomed. Then, in came the 10:00 buy program / stop run, which pushed the ES all the way up to 2578.75 at 11:13.
From there, the ES pulled back a few handles, then traded up to another new high 2579.25, pulled back down to 2576.25, and then shot up to the high of the day at 2580.75, at 1:22 CT. Late in the session, the ES sold off down to 2575.75, and rallied back up to 2579.00 on the close, as the MiM went from over $400 million to buy to $1.3 billion to buy.
In the end it was an explosive day of new all time contract highs, all driven by tech stock earnings. The S&P 500 futures (ESZ17:CME) settled at 2578.50, up +17.00 handles, or +0.65%; the Dow Jones futures (YMZ17:CBT) settled at 23372, up +23 points, or +0.09%; the Nasdaq 100 futures (NQZ17:CME) settled at 6215.25, up +130.50 points, or +2.09%; and the Russell 2000 (RTYZ17:CME) settled at 1508.00, up +8.40 points or +0.55% on the day. Even Japan’s Nikkei gained 2.6% last week, trading up to its highest level since 1996.
While You Were Sleeping

Overnight, equity markets in Asia traded mixed, with a slight bias to the upside, with the New Zealands NZSX 50 leading the way, closing up +0.73%. Meanwhile, in Europe, stocks are currently trading weaker, being held down by the FTSE, which is down -0.30%.
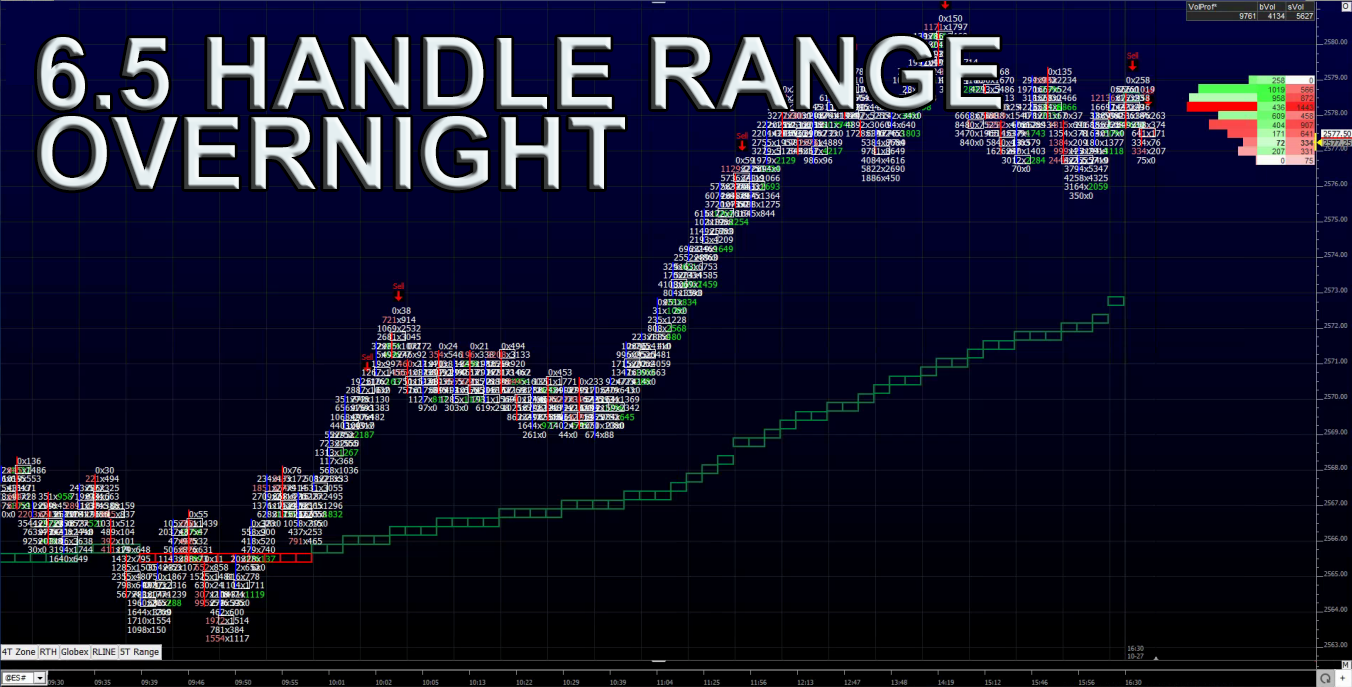
In the U.S., the S&P 500 futures opened last night’s globex session at 2575.50, and spiked up to print the overnight high at 2578.25 in the first 15 minutes of trading. From there, the ES followed suit with the weakness overseas and began a slow grind lower, printing the overnight low of 2571.75 just before 6:00am CT. As of 7:10am CT, the last print in the ES is 2573.50, down -5.00 handles, with 128k contracts traded.
In Asia, 6 out of 11 markets closed higher (Shanghai -0.77%), and in Europe 9 out of 12 markets are trading lower this morning (FTSE -0.30%).
Today’s economic calendar includes Personal Income and Outlays, Dallas Fed Mfg Survey, a 4-Week Bill Announcement, a 3-Month Bill Auction, a 6-Month Bill Auction and Farm Prices.
Investors Pain; Waiting For The Dips
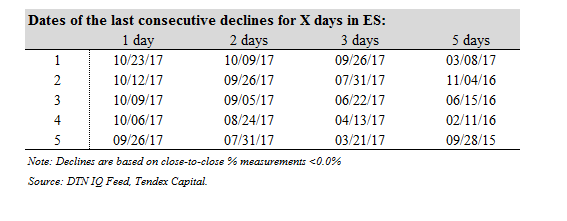
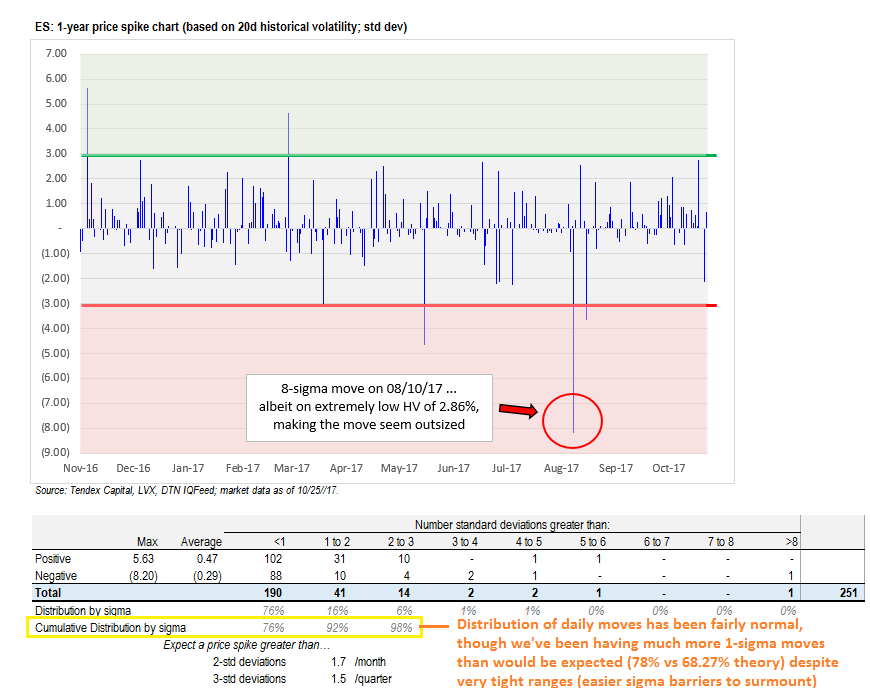
Our View: The index hasn’t had a decline of 10% or more from a recent peak since February 2016. I asked Joseph Abboud from tendexcapital.com to give me the last 5 – 1 day, last 5- 2 day, last 5 – 3 day, last 4 -5 day and the last 5 -5 day declines. He also threw in the ES 1 year ‘spike chart’ based on 20 day historical volatility. But, as you can see, there are 1 day declines and 2 day declines, but the infrequency of 3, 4, and 5 day declines is somewhat astonishing. Even getting a one day decline doesn’t happen very often. Plain and simple, if you are an investor waiting for a sell off / correction to put money to work in the stock market, there are just none to be had.


The S&P 500 fell 11% over 6 trading days in August of 2015, and it took until November of that year to recoup the loss. In June of 2016 the S&P dropped 5.3% during the post Brexit 2 day decline, it took 3 days for the S&P to recover. In May, FBI director James Comey said that Trump asked him to drop an investigation into former National Security Adviser Michael Flynn, the S&P dropped 1.8%, it also took 3 days for the S&P to recover.
Our view, I agree things have gotten a bit out of hand, but I also think Friday’s blast up is a prelude to S&P 2600.00. You can sell the gap higher open or the first rally above the gap up, or just wait for a pullback and be a buyer.
PitBull: CLZ OSC 15/5 turns down on a close below 52.02; ESZ OSC 5/21 turns down on a close below 2557.18; VIX OSC 7/8 turns up on a close above 11.98.
