by Eli Wright
US as well as global equity markets had no problem shrugging off the result of Sunday's Italian referendum vote, as equity markets, banks, as well as the euro, rose broadly through the day yesterday and early this morning in Asian trade. Oil prices, however, slipped off their highs from earlier this week as OPEC continues to try to convince non-members to join the production freeze bandwagon.
Since investors appear to continue to ignore the news, barring any surprises, general profit-taking or tomorrow’s ECB policy meeting could be the next drivers for markets.
In Asia overnight the Nikkei rose 0.74% to 18,496.69; the Shanghai Composite increased 0.69% to 3,221.64; and the Hang Seng bumped 0.54% higher, to 22,797.
In Europe midday, the FTSE is up 1.39% to 6,874; the DAX is up 1.45% to 10,932.5; the Stoxx 50 is up 1% to 3,133.
US markets closed higher yesterday: the Dow again set a new record, up 0.18% to 19,251.78; the S&P 500 added 0.34% to close at 2,212.23; and the NASDAQ Composite gained 0.45% to finish at 5,333. The Russell 2000 also rose 1.01%, to close at 1,351.09. Seems rumors of the Trump Rally coming to an end have been overstated...at least for now. With markets currently near all-time highs, it might be wise to take some profits now for use during the next swing low.
In pre-market trading, the Dow is up 0.06%, the S&P and NASDAQ are flat.
US bond yields remained steady. The 2-year note is at 1.124%, the 10-year yield is at 2.391%, and the 30-year yield is at 3.074%. For now the yield rally appears to be on track.
Forex
The US Dollar Index slipped a bit this week, but is still managing to remain above 100 – it's currently trading at 100.53.
The euro slipped 0.33% yesterday, but remained above $1.07. The single currency hasn’t lost much since the Italian referendum.
Nevertheless, the outlook for the EUR/USD remains clouded by the Italian banking sector, as well as by the ECB’s divergent QE program, whose continuation is expected to be announced tomorrow.
Sterling, which hit nine-week highs earlier this week, has fallen about 0.4% to $1.2624. Pullbacks should now find support down near the 1.2520 area.
Commodity currencies have been driven lower by oil prices dropping more than 2%. However the Aussie's decline had an additional impetus, Australia's Q3 GDP reading came in unexpectedly lower, -0.5% versus +0.3% expected.
Widespread rumors on social media yesterday that the Chinese yuan had plummeted 10% proved to be unfounded, reflecting an operational glitch in some trading systems. In fact, due to the Chinese governments tight currency controls, it's virtually impossible for the currency to drop that much without government engineering. China reports monthly trade balance figures this evening. Results are expected to be a net positive of $46.3 billion.
Commodities
Oil is losing its upward momentum, gained following the OPEC deal to cut production. After moving down this morning, Crude and Brent are each up a tad—about 0.25%. Several factors are contributing to the pullback:
- The freeze deal only covers a six month period and investors worry that’s not enough time to make a significant dent in the glut of oil supplies.
- In order for the cut to be truly effective , OPEC needs non-OPEC members such as Russia to join the deal.
- The OPEC deal was based on October production numbers, which were at record highs.
- US shale output is expected to increase now that the price per barrel has crossed the $50 threshold. Over the past few months, data from Baker Hughes has been showing consistently growing rig counts.
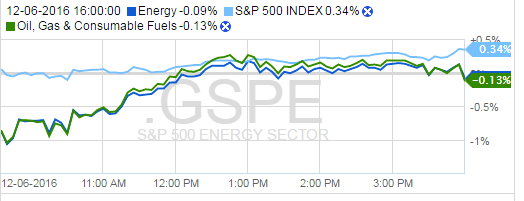
The downward movement in oil pushed Energy sector stocks down yesterday as a result, even as natural gas increased by 2% to $3.707.

Source: Fidelity.com
With the US dollar high and equity markets doing well, there’s no reason for investors to seek safe-havens such as gold; the yellow metal remains down, currently at $1,174.05. Other precious metals, including silver and platinum are stuck in a downtrend as well.
Copper, on the other hand, has been aggressively moving over the past month or so, rising to $2.692 at time of writing.
Stocks
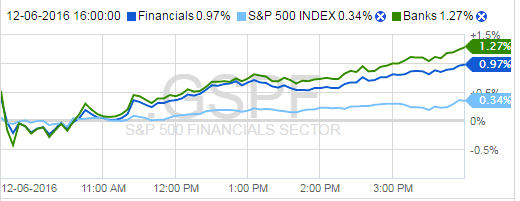
Banking stocks in the United States and Europe performed nicely yesterday. Compared to the overall S&P gain of 0.34%, Financials were up 0.97%; banks added 1.27%.

Source: Fidelity.com
SunTrust (NYSE:STI) and Wells Fargo (NYSE:WFC) both added more than 2% yesterday; Citizens (NYSE:CFG) and Bank of America (NYSE:BAC) gained more than 1%.
In moves that were likely just short covering, Italian banks saw shares rise nine percent for their biggest rally in five months on Tuesday. Despite fears that the political vacuum created by the no vote and Renzi's resignation could jeopardize the country's third largest lender Banca Monte dei Paschi di Siena SpA (MI:BMPS), rated the weakest in European stress tests earlier this year, shares of the bank jumped nearly 6%. Unicredit (MI:CRDI), Italy’s largest bank, gained 2.6%. The MSCI Europe Banks ETF (DE:CB5) gained 4%.
In the US today, earnings reports continue:
Costco (NASDAQ:COST), the world’s third-largest retailer (by sales), behind only Wal-Mart (NYSE:WMT) and Amazon (NASDAQ:AMZN), is set to report Q1 2017 earnings after the market close later today, with expected EPS of $1.19 on $27.57 billion in revenue. Costco's unique business model gives it an edge: unlike other bricks-and-mortar behemoths like Wal-Mart and Target (NYSE:TGT), Costco doesn’t worry much about online sales. Rather it focuses on the in-store experience and membership fees.
Costco’s razor-thin margins average 11%, far less than the nearly 24% markup at Wal-Mart. Despite being only 4% of the company’s revenue, 75% of Costco’s profits come from its membership fees. Traditionally, Costco has maintained over 90% membership renewal, and following their co-branded credit card switch earlier this year, renewals are expected to bump higher. Profits from this segment of the business could receive an additional boost if the company increases membership fees from the current $55.
Of particular interest, Costco’s fastest-growing demographic is millennials, indicating that despite the company's weak on-line presence, Costco might just be the bricks-and-mortar retailer that survives—and thrives—without any real online growth.

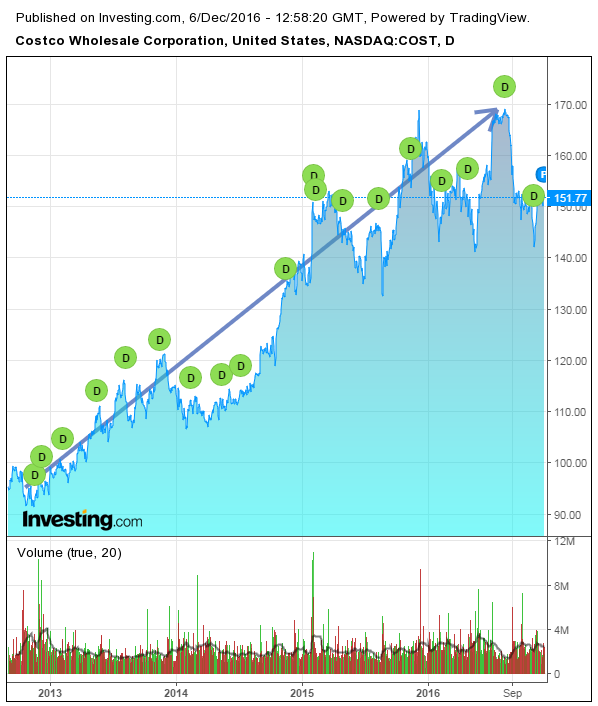
Costco stock has been on a persistent uptrend for four years now, most recently testing strong resistance at $169. However, even though shares are down approximately 6% this calendar year, currently at $151, now might not be a great time to buy. With its non-traditional business model, it is difficult to compare Costco to its retail peers. Nevertheless, Costco’s P/E ratio is 28.47, nearly double that of Wal-Mart and Target. Costco will need to prove it has long-term upside in order to justify the higher valuation. The company plans to add 31 new stores over the next fiscal year.
Popular athletic apparel company Lululemon Athletica (NASDAQ:LULU) also reports after the market close. Expected Q3 2016 EPS is $0.43 on revenue of $540.43 million.
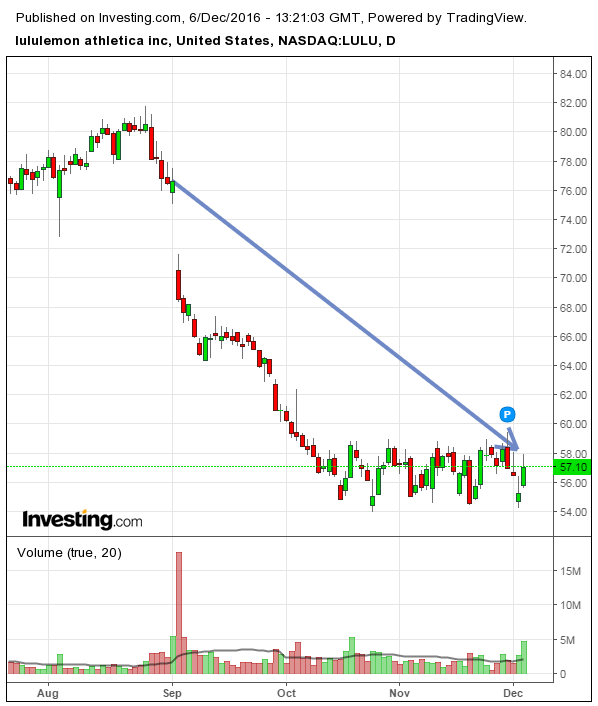
Last quarter, Lululemon’s report was mixed: sales rose 14% YoY, net income climbed 12%, and EPS met investor expectations. However same-store sales growth came in below forecast, and the company revised its Q3 outlook toward the lower end of analyst expectations. After Lululemon shares reached all-time highs over the summer, its Q2 report didn't inspire investor confidence and shares immediately fell more than 8%. They haven’t picked up since, currently down more than 25%.

Part of the decline may be due to a decrease in growth. In Q2, Lululemon added only six stores, down from eleven in the previous quarter. It may also be due to fashion's shift away from athleisure toward denim, as well as increasing competition from Nike (NYSE:NKE), Under Armour (NYSE:UA), and others. Of note, in the company's last SEC filing, Lululemon removed the words “developing the highest quality products” from their list of core values. We don’t want to read too much into this, but a decrease in quality could make it difficult for Lululemon to maintain its premium pricing model.
Average consensus is for a 12-month outlook with a $67.30 price target, which would be an increase of nearly 18%. $39 is the low end of target, which would constitute a 32% decline in value.
