-
All major US index in longest winning streak since January
-
VIX still high; havens rise, signaling investors still jittery
-
All eyes on CPI
-
Complex analysis suggests high volatility, whatever the CPI report
-
Euro disdains best GDP performance in a decade
-
WTI falls under $59
Key Events
Yesterday, a synchronized decline in yields and the US dollar for a third straight day supported a mirror-image from equities: a third consecutive advance by US stocks, as investors count the minutes till this morning's release of the US CPI inflation report.
All four major US indices—the S&P 500, Dow, NASDAQ Composite and Russell 2000—advanced, posting their longest winning streak since January.
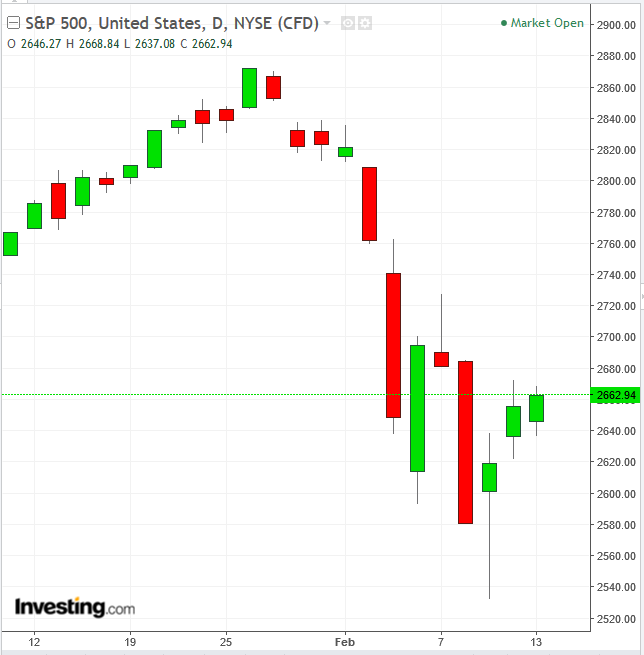
The S&P 500 climbed 0.26 percent, led by a 0.73 percent bump higher in Real Estate. Energy and Materials were the only two sectors in the red, losing 0.39 percent and 0.25 percent respectively.
Energy stocks were pulled down by seven days of declines in the price of oil within eight days, while the drop in Materials shares may have been led by traders cashing in after the sector's outperformance during Tuesday's session.
Falling Treasury yields slowed the migration of funds out of an erratic equity market into more secure, higher-yielding assets, while the weakening dollar simply makes dollar-based assets proportionately cheaper.
However, the known fundamental driver of the equity selloff was the sudden realization by investors that rates may go higher, and at a faster pace than anticipated, upsetting complex intermarket and highly-leveraged derivative positions and forcing hedge funds to liquidate, dumping more supply all at once than can be handled by demand.
The sudden shift in outlook follows the recent employment report that average hourly earnings rose 2.9 percent YoY, not only more quickly than anticipated, but also at the fastest rate since 2009. Higher wages increase the likelihood that corporates will raise the prices of their goods and services to cover these costs, which in turn spurs inflation. Whereupon the Fed would increase rates to avert the risk that inflation gets out of hand, which ultimately pushes up the cost of borrowing, whose unprecedented affordability has pushed equity prices to record highs.
It thus comes as no surprise that today’s CPI reading is likely to be the most watched in a long time. Investors will look for further inflationary signals that could warrant a faster pace of interest rates hikes, or for clues that the previous CPI reading represented an anomaly.
Economists forecast that core CPI (excluding volatile food and energy prices) climbed 1.7 percent YoY in January, compared with 1.8 percent in December. However, from another point of view, inflation may have grown: a 0.2 percent MoM rise in the same indicator, as economists forecast, would result in a three-month annualized rate of 2.3 percent, according to analysts at Wells Fargo Securities. That would mark the fastest pace since February 2017.
However, the calculation is more complex. In order to extrapolate inflation projections from CPI data, investors must analyze different aspects of the report, including the unexpected increase in some particular components of the previous monthly report, such as medical goods and cars. Then, they must adjust figures to the assumption that companies tend to hike prices in the beginning of the year, as they test consumer demand. Finally, they need to gauge variations in how data is tracked and whether they have an impact on the projection and how.
After they get through the other side of this labyrinth, they need to formulate an intelligent trading plan, according to the potentially changed economic environment. As we have already experienced, the market narrative on economic figures can change from the time data is released, morphing in the following days and even weeks. Therefore, regardless of what the report actually reveals, there’s a good chance that knee-jerk reactions, buyer and seller remorse and investors navigating through the maze of figures will result in considerable volatility.
Meanwhile, institutions have raised their stakes in Treasury futures to a record, signaling an expectation that the current bond selloff is not quite over yet, with some forecasting 10-year yields will rise to 3.5 percent in the next six months and pricing in a yet steeper pace of Fed tightening.
Global Financial Affairs
This morning, global stocks extended their rebound from the worst two-week selloff in two years, with Asian markets taking the lead. The MSCI Asia Pacific Index benefited from surges in Chinese shares listed both on the mainland’s Shanghai Composite and on Hong Kong’s Hang Seng Index, as well as gains in South Korea’s KOSPI and Australia’s S&P/ASX 200 Index.
Japan was the only key market to post a retreat, with shares losing ground both on the TOPIX and the Nikkei 225.
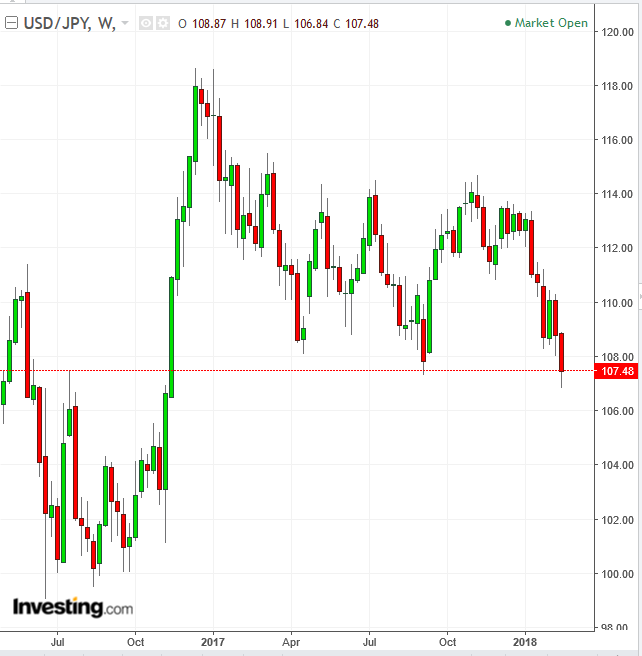
However, declines in the influential Japanese benchmarks were not linked to the recent global selloff but rather to a local situation: the yen soared to a 15-month high, hurting exports and rendering yen-denominated shares more expensive via the exchange rate, thus pushing both indices to near 4-month lows.
Stocks in Europe climbed after Germany’s GDP rose 0.6 percent in the fourth quarter, as its economy expanded 2.9 percent annually. The report backed the European Commission’s claim that the region’s expansion is the most balanced since the financial crisis and the IMF’s improved global outlook for the year. The region registered its best performance in ten years in 2017, signaling the ECB could soon proceed to reduce its balance sheet.
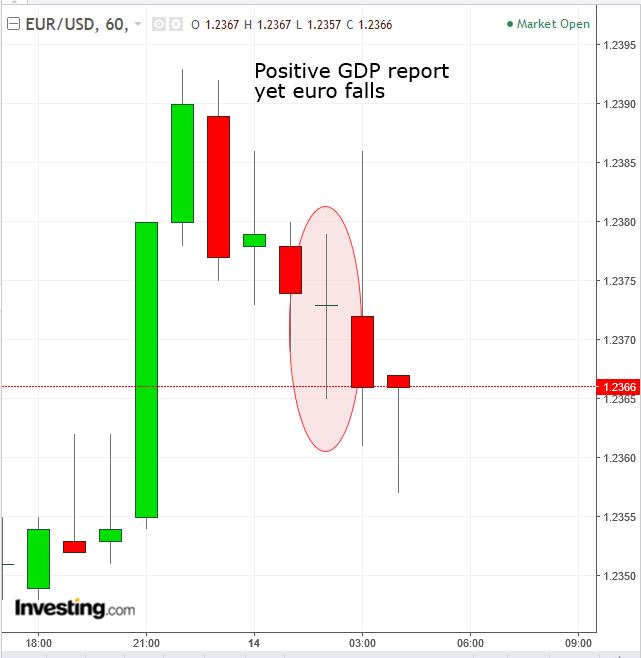
Curiously, the eurozone's strongly upbeat growth figures did not boost the single currency, which kept falling.
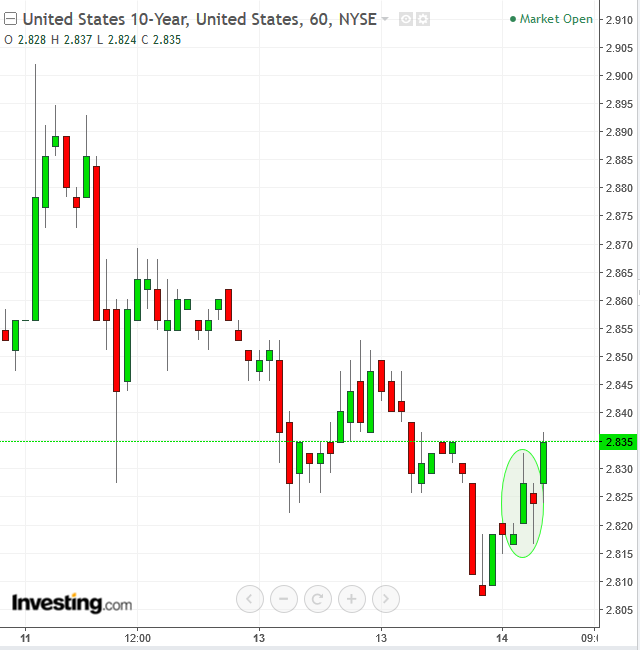
Possibly, that's because US Treasury yields started climbing again.
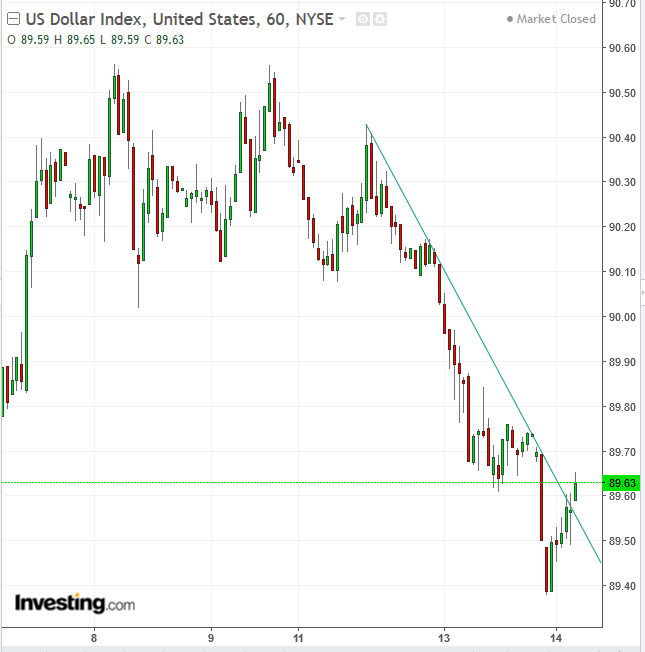
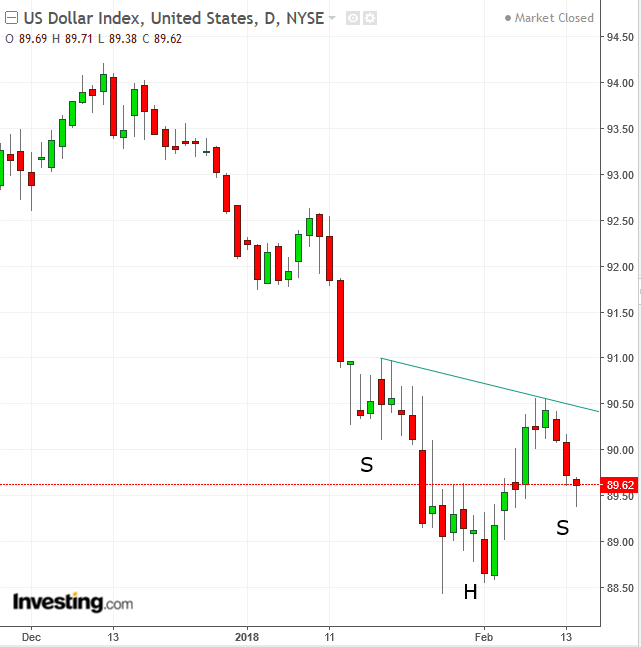
The dollar, on the other hand, is on the rise, paring a daily loss as it crossed above a downtrend line since Monday.
Ironically, despite a third day of advances for stocks, safe haven assets continued to gain traction. As mentioned above, the yen is set for its strongest close since November 2016, when the dollar fell prior to President Donald Trump becoming "the market’s savior".
The Swiss franc and gold are up. Does this signal that investors don’t trust equities yet, or are these safe haven categories simply rising on a falling dollar? Treasury yields, normally an indicator for risk aversion, do not currently apply, as buying Treasuries – generally, a bearish indicator for stocks – are now a bullish indicator, as they unwind the very cause of the selloff.
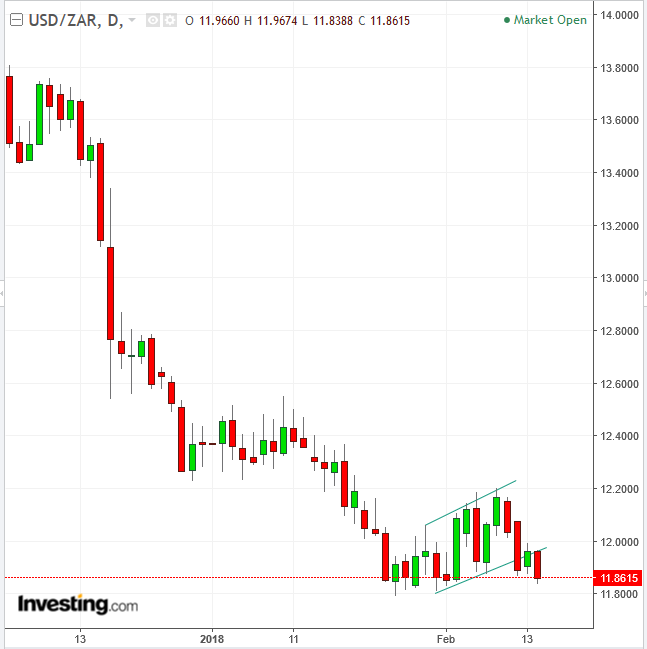
South Africa’ rand climbed as the nation awaited President Jacob Zuma's response to his party’s request that he resign. As mentioned yesterday, the USD/ZAR pair appears to have completed a bearish, Rising Flag, and is falling on the good news.
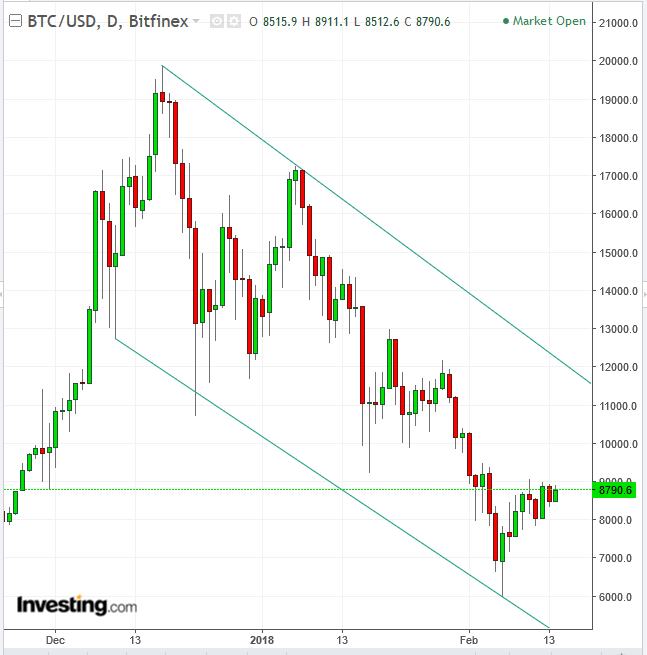
On Friday JP Morgan Chase sent a note to clients calling the creation of a Bitcoin ETF a “holy grail” that could become a gamechanger. It would provide easier access to the cryptocurrency, a liquid market and added integrity, since it would be traded through brokerage accounts that carry insurance via SIPC.
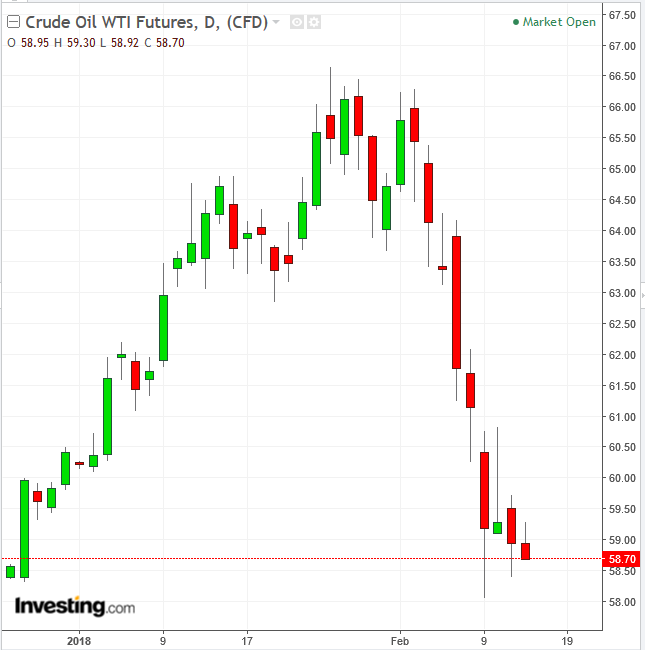
WTI crude oil fell below $59, even on a weaker dollar, extending the worst weekly performance for the commodity in two years, on the prospect of rising US supplies.
Up Ahead
-
Eurostat will update its estimate for fourth-quarter growth in the euro area at 11am in Luxembourg. It reported a 0.6 percent increase in GDP on January 30.
-
Lunar new year celebrations for the Year of the Dog begin, affecting business hours in China, Hong Kong, Taiwan, Singapore, Malaysia and Indonesia. Chinese mainland markets are closed February 15-21.
-
The US core consumer price index is expected to have increased at an annual 1.7 percent pace in January, according to economists project. Retail sales, also out Wednesday, probably increased for a fifth straight month.
Earnings:
-
Cisco Systems (NASDAQ:CSCO), expected to report corporate results after market close for the fiscal quarter ending January, is forecasted to post a $0.53 EPS, versus $0.53 YoY.
-
TripAdvisor (NASDAQ:TRIP), scheduled to release earnings after market close, for the fiscal quarter ending December, expected to have a $0.04 EPS vs $0.05 for the same quarter last year
-
SunPower Corporation (NASDAQ:SPWR) will report earnings after market close, for the fiscal quarter ending December. The forecast is a $-0.09 EPS versus $-0.73 year-over-year.
Market Moves
Stocks
-
The STOXX Europe 600 Index increased 0.9 percent as of 9:05 a.m. London time.
-
UK's FTSE 100 climbed 0.7 percent.
-
Germany’s DAX Index gained 0.9 percent.
-
S&P 500 Futures rose 0.5 percent.
-
The MSCI Asia Pacific Index rose 0.3 percent.
-
TOPIX index fell 0.8 percent, Hong Kong’s Hang Seng Index gained 2.5 percent, the KOSPI rose 1.1 percent and Australia’s S&P/ASX 200 Index fell 0.3 percent.
Currencies
-
The Dollar Index is down 0.15 percent, paring an earlier 0.4 dip. A close at this level would form a hammer and a potential for a H&S bottom.
-
The euro climbed 0.1 percent to $1.2361.
-
The British pound fell less than 0.05 percent to $1.3888.
-
The Japanese yen gained 0.3 percent to 107.47 per dollar, the strongest in 15 months.
-
South Africa’s rand jumped 1 percent to 11.8503 per dollar, the strongest in almost three years.
Bonds
-
The yield on US 10-year Treasuries fell less than one basis point to 2.83 percent.
-
Germany’s 10-year yield declined two basis points to 0.74 percent.
-
UK 10-year yield dipped one basis point to 1.618 percent.
-
Japan's 10-Year yield decreased one basis point to 0.07 percent, the lowest in more than five weeks.
Commodities
-
West Texas Intermediate crude dipped 0.6 percent to $58.81 a barrel, the lowest in almost eight weeks.
-
Gold rose 0.1 percent to $1,331.14 an ounce.
