-
Biggest 2-day US equity rally in 18 months
-
VIX falls; still at its highest since Brexit vote
-
Investors eye Wednesday’s US CPI data
-
WTI under $60 and falling on IEA forecast for 2018 oversupply
-
Brent decline extends for an eighth session
-
Ripple-UAE Exchange partnership pushes alt-currency back above $1.00
-
Lunar new year celebrations for the Year of the Dog begin, affecting business hours in China, Hong Kong, Taiwan, Singapore, Malaysia and Indonesia. Chinese mainland markets are closed from February 15 to February 21. India is closed on Tuesday for a public holiday.
-
The US consumer-price index probably increased at a moderate pace in January, economists project. Retail sales, also out Wednesday, probably increased for a fifth straight month.
-
Japan is expected to extend the longest stretch of economic growth since the mid-1990s when it reports fourth-quarter gross domestic product on Wednesday.
- Pepsico (NASDAQ:PEP) is scheduled to release earnings before market open, covering the fiscal quarter ending December 2017. Analysts from Zacks Investment Research forecast a $1.3 EPS vs $1.35 YoY.
- MetLife (NYSE:MET) is expected to report results after market close for the fiscal quarter ending December. Based on a consensus view from Zacks Investment Research's analysts, EPS should come in at $1.1 vs $1.35 YoY.
-
The Stoxx Europe 600 Index increased 0.1 percent as of 8:24 a.m. London time (3:24 EST).
-
The MSCI All-Country World Equity Index gained 0.2 percent.
-
UK’s FTSE 100 advanced 0.2 percent.
-
The dollar Index slid for a second day, decreasing 0.3 percent, to a two-day total of 0.7 percent.
-
The euro advanced 0.3 percent to $1.2324, the strongest level it has seen in a week.
-
The British pound gained 0.2 percent to $1.3861.
-
South Africa’s rand increased less than 0.05 percent to 11.9334 per dollar, the strongest in a week.
-
The yield on 10-year Treasuries fell three basis points to 2.83 percent, the biggest drop in more than a week.
-
Germany’s 10-year yield declined two basis points to 0.74 percent, the lowest in a week on the largest fall in a week.
-
UK's 10-year Giltsdipped one basis point to 1.601 percent.
Key Events
US stocks extended a rebound on Monday, consolidating their biggest two-day advance in 18 months, after suffering their worst two weeks in two years. The rebound was helped by the 10-year Treasury yield falling from the 4-year high that had started the equity selloff, and a dollar decline that turned stock prices indirectly cheaper.
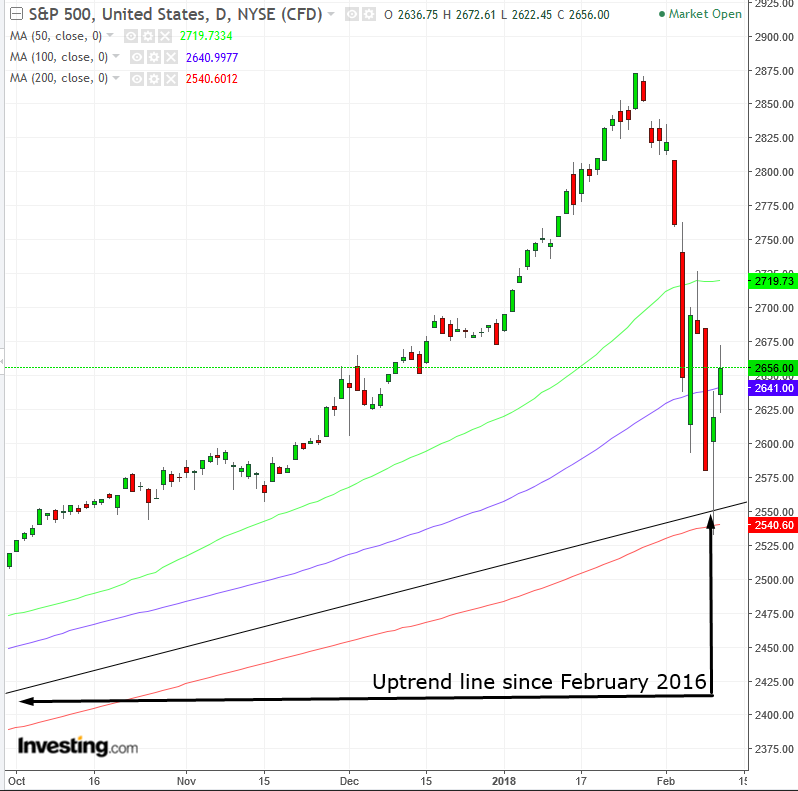
The S&P 500 rose for a second day, up 1.39 percent, bringing the rebound to 2.93 percent, or 4.88 percent from Friday’s 2,532.69 intraday low. The index's price is now 0.6 percent lower than the final 2,673.61 closing price for 2017.
All sectors were in the green, led by a 2.02 percent jump in Materials and a 0.27 percent advance by Real Estate taking up the lagging position.
Technically, Friday’s intraday low found support in a rising trend line since February 2016 and 200 dma (red) and retook the 100 dma (blue).
The Dow Jones Industrial Average outperformed, advancing for a second day by 1.75 percent, bagging an aggregate 3.15 percent gain, or 5.3 percent from Friday’s 23,360.39 intraday low. Its price is now just 0.35 percent from where it finished at the end of last year.
The NASDAQ Composite climbed for a second day, going higher by 1.55 percent, hitting a 3.00 percent rebound, or 5.3 percent from Friday’s 6,630.67 intraday low. The price is up 1.2 percent for the year, which marks an outperformance on a yearly basis.
The Russell 2000 also gained for a second day, although it underperformed its peers with a 1 percent increase, which tallied up the rebound to just 1.9 percent, or 3.95 percent from Friday’s 1,434.66 intraday low. The small-cap index also underperformed on a year-to-date basis, coming in 2.8 percent lower than at the end of December.
Global Financial Affairs
This morning, European shares are little changed after a mixed Asian session which saw a late decline. Traders still feel unsteady after the recent historically wild swings. The STOXX Europe 600 retreated slightly in early trading after yesterday’s jump. S&P 500 Futures also fell.
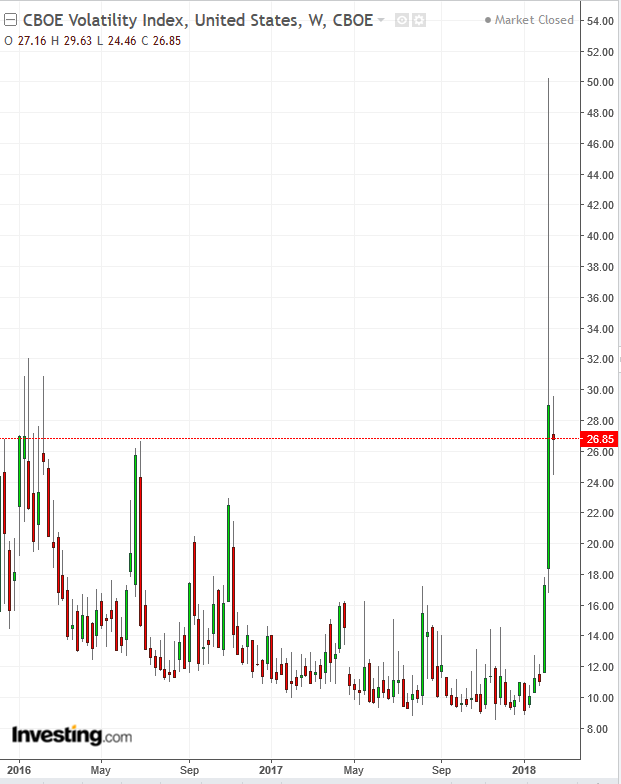
Naturally, the generally upbeat global rally reduced bets that the VIX would climb. This allowed the volatility index, also sometimes referred to as the fear gauge, to subside. However, at almost 27, it is still at its highest level since June 23 2016, when the UK's Brexit vote raised anxiety of a disruption to the global financial system.
These ongoing, elevated levels demonstrate that traders are still shaken up from the recent stock market rout, which wiped out $2 trillion from US equity markets.
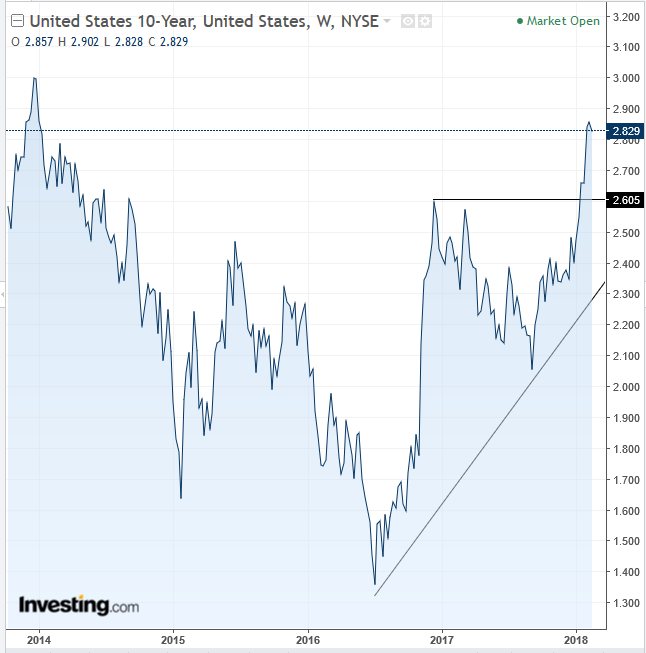
The trigger for the recent Treasury selloff and spike in yields was the higher reading in wage growth. This is a leading indicator of an uptrend in inflation, which in turns increases the outlook for faster interest rate hikes. Higher rates would push yields up, thus favoring a rotation of funds out of stocks and into bonds, albeit mostly short-term notes. (Read here for a more extensive explanation).
It is thus only natural that investor attention is now laser-focused on upcoming US consumer price data, which will be released Wednesday. Buckle up. Good or bad—it could get bumpy.
Meanwhile, Goldman Sachs and JP Morgan Chase have advised clients to stock up and buy the dip. Even Michael Wilson, Morgan Stanley)’s chief US equity strategist, who last week warned investors against buying the dip, has joined his peers, forecasting a 10 percent rise from current prices on the back of “one last surge of euphoria.”
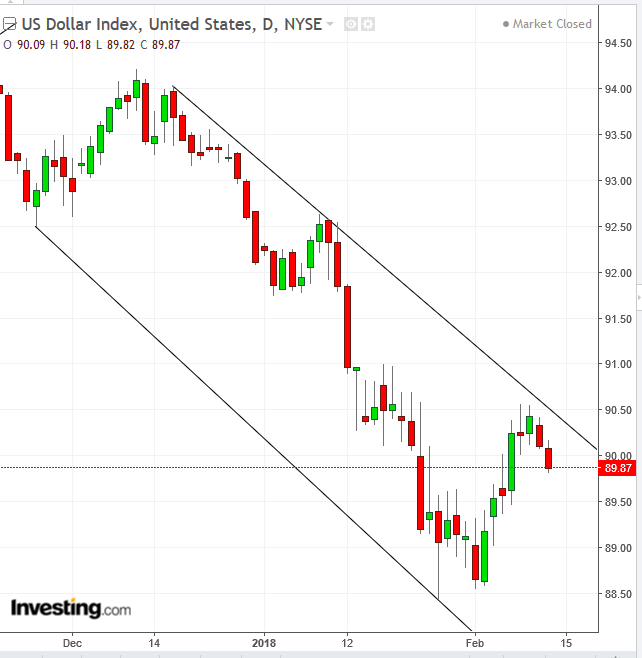
To a lesser degree than falling Treasury yields, a second-day decline in the dollar also supports USD-denominated stocks, since they are rendered cheaper by the weaker currency. This second-day slide confirms the falling channel, implied a retest of the 88.50 level.
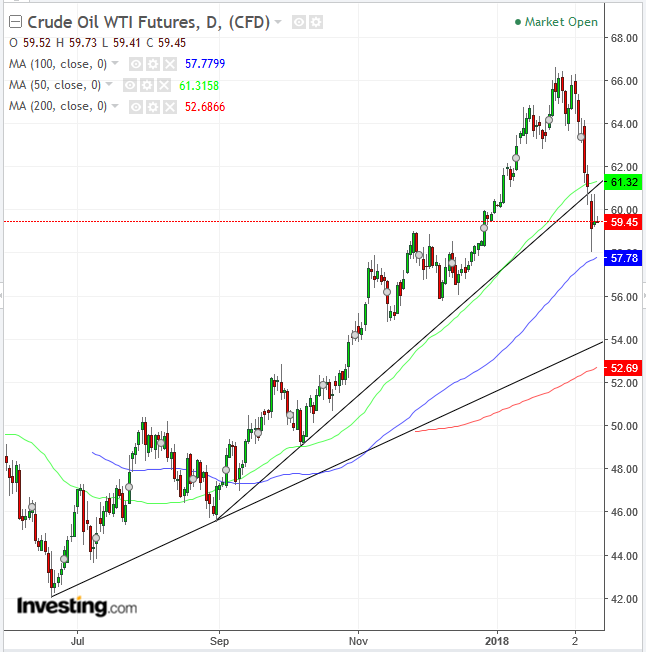
A weakening dollar also supports commodities, pushing metals and WTI crude higher. However, the IEA report stating that US-led global oil production will probably overcome demand this year pushed prices back down. Technically, Friday’s intraday WTI low found support by the November-December congestion, and its closing price was supported by the congestion’s November 24 peak. At the time, the consolidation provided support, as all market participants and observers will remember that it was followed by an impressive 15 percent spike.
WTI price remains little changed today, after yesterday’s inverted hammer, bullish upon a confirmation, when the price closes above its real body (price range between open and close, disregarding outside prices, marked by shadows). However, investors should note that the price has fallen below its uptrend line since September 2017.
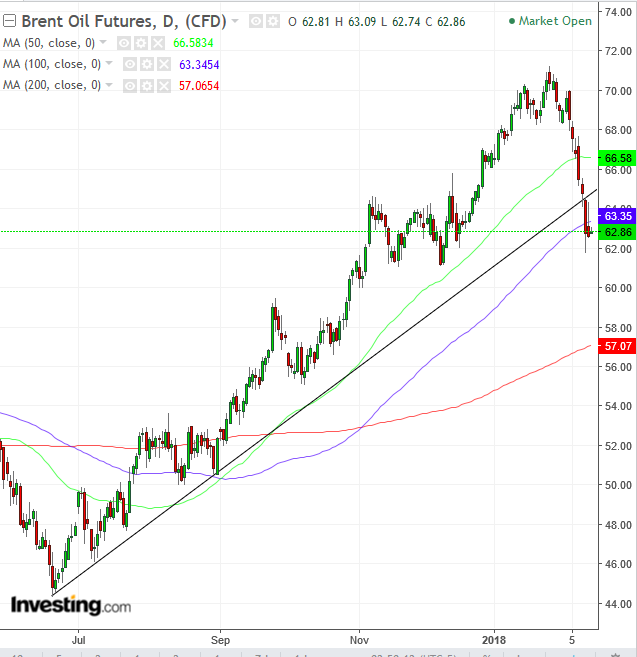
Meanwhile, Brent crude extended a decline for an eighth consecutive day, after it had advanced on a weaker dollar following the release of the IEA report. Its technical picture is worse than that of WTI, as it has fallen below both its 100 dma (blue) and its uptrend line all the way from June. WTI is well above both thresholds, specially its June uptrend line.
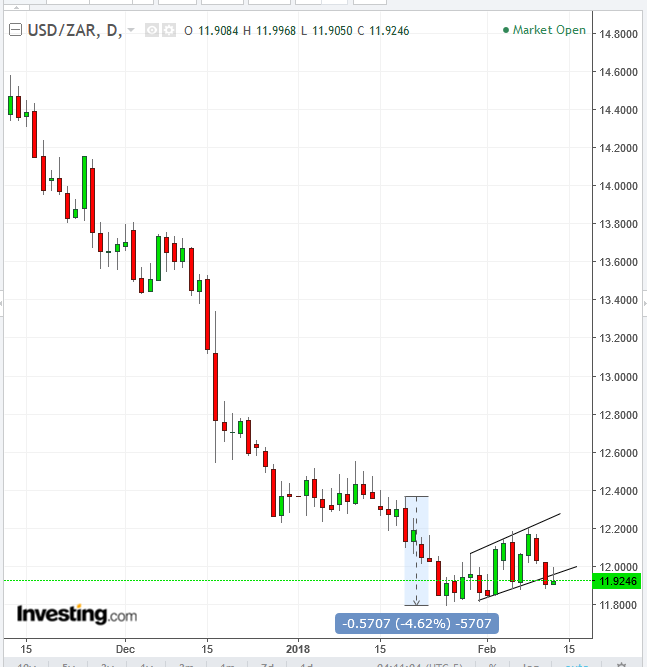
South Africa’s rand climbed as the country’s ruling party, the African National Congress, decided to order President Jacob Zuma to step down. However, the emerging market currency may have already provided a downside breakout to a bearish Rising Flag, with an implied 5-percent downside target.
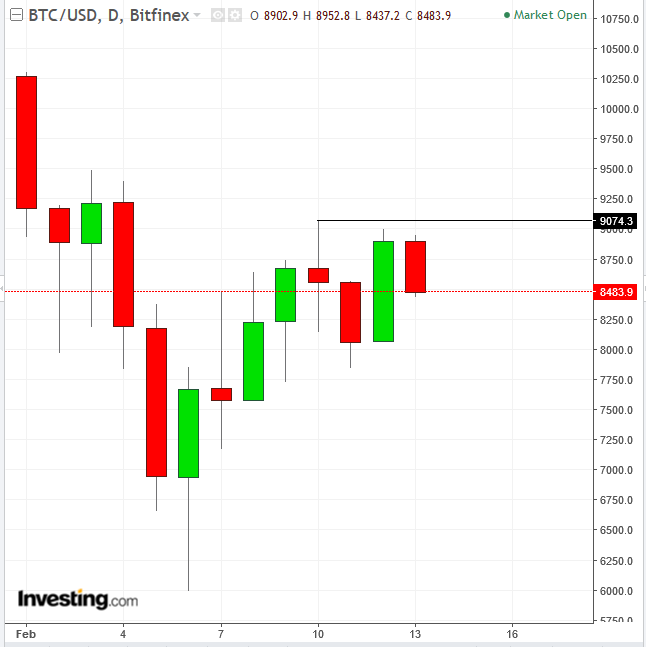
In alt-currency news, Pantera Capital's founder and CEO Dan Morehead made a bullish call on Bitcoin. The digital token entered the 53rd day of what's claimed to be its average 71-day bear market. “So, it seems like another couple of weeks and everything will be kind of normal and it could start grinding back up,” Morehead told CNBC's Fast Money on Monday.
Technically, BTC has continued to remain beneath supply pressure at the $9,000 level, its Saturday peak.
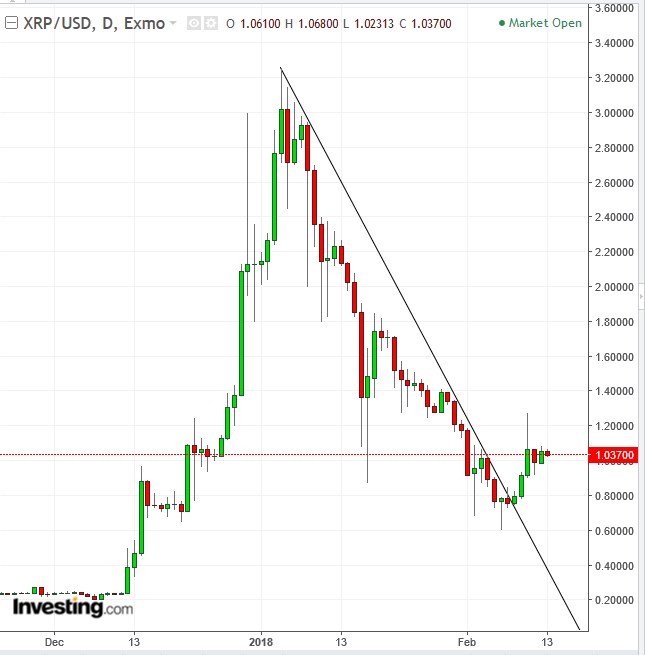
Ripple got a legitimacy-boost from a partnership with the UAE Exchange, which will use the alt-currency for cross border payments. The Middle East based exchange aims to bring its current 6.75-percent market share up to a 10-percent slice. The cryptocurrency climbed back above the $1.00 key level. As opposed to Bitcoin, it has provided a meaningful upside breakout to its downtrend line, signaling an upside reversal.
Up Ahead
Earnings:
Market Moves
Stocks
Currencies
Bonds
Commodities
