- Curve inversion steepens as yields resume their plunge
- European shares and U.S. futures climb with safe-haven assets, in rare formation
- Chinese stocks' heavy underperformance raises red flag for global bull market
- WTI slips into bear market but posts some gains on threat of U.S.-Iran conflict
- Some Asian and Middle Eastern markets are closed for holidays.
- The European Central Bank sets policy on Thursday.
- Theresa May steps down as leader of the Conservative Party on Friday.
- Friday’s U.S. jobs report is projected to show payrolls rose by 180,000 in May, unemployment held at 3.6%, a 49-year low, and average hourly earnings growth sustained a 3.2% pace.
- Finance ministers and central bank governors from the G-20 nations gather in Fukuoka, Japan this weekend.
- The U.K.’s FTSE 100 advanced 0.1%, the highest in more than a week.
- The MSCI Emerging Market Index slid 0.3%, the biggest decrease in two weeks.
- The MSCI Asia Pacific Index declined 0.3%, the largest drop in more than a week.
- The Dollar Index dropped 0.1%.
- The euro increased 0.1% to $1.1227.
- The British pound declined 0.1% to $1.2671, the biggest fall in a week.
- The yield on 10-year Treasurys fell two basis points to 2.12%.
- Germany’s 10-year yield was unchanged at -0.23%, at about the lowest on record.
- Britain’s 10-year yield slipped one basis point to 0.852%, the lowest in almost three years.
- West Texas Intermediate crude advanced 0.3% to $51.86 a barrel.
Key Events
U.S. Treasurys returned to the spotlight this morning, climbing again after U.S. President Donald Trump lamented lack of progress with Mexico, thereby increasing the odds he'll press ahead with tariffs on the Latin American country. Oil entered a bear market, further darkening the horizon and prompting gains in gold as well. However, European stocks gained ground for the fourth straight day and U.S. futures also stood safely in green territory, in rare formation as both risk and safe-haven assets edged higher.
Futures on the S&P 500, Dow and NASDAQ 100 suggested the sharpest two-day rally since the beginning of the year may resume. Meanwhile, the STOXX 600 advanced with utilities and healthcare, which offset losses in carmakers triggered by a failed merger attempt between Fiat Chrysler (NYSE:FCAU) and Renault (PA:RENA). Renault’s shares plunged as much as 8% in Paris and Fiat was traded 3.8% lower in Milan—though both recouped some losses in the later European morning— after investors saw prospects of what could have been a group worth $39 billion of combined market value and the world’s third-largest carmaker evaporate.
In the earlier Asian session, regional stocks slid lower as trade negotiations on both the Chinese and the Mexican front were derailed, with the latter pressuring the Mexican peso lower. Data from the U.S. showing the weakest job creation in almost a decade worsened sentiment.

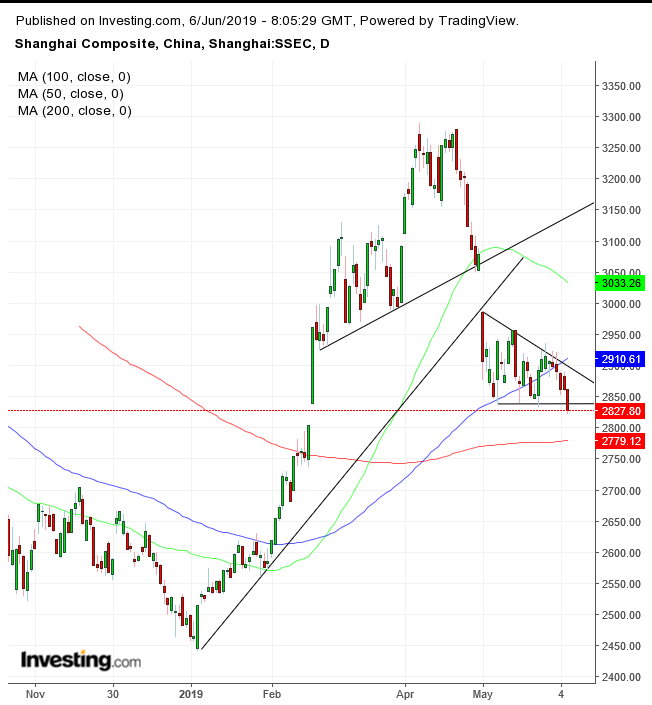
China’s Shanghai Composite (-1.17%) fell for the fifth day in a row—even after a $72 billion injection from policymakers, the second largest on record—closing slightly below a bearish descending triangle, exactly one-month in the making. The 200 DMA, 1.65% lower, may be the last support before a continued decline. Could global stocks, including U.S. equities, continue trading in a bull market if Chinese stocks crash? Probably not. The chart of the Chinese benchmark may in that sense provide a leading indicator of the end of the bull market.
Global Financial Affairs
U.S. shares added to the biggest rally since early January as Trump initially said Mexico was keen on sealing a deal and White House trade adviser Peter Navarro bolstered optimism saying Mexico could still avoid tariffs.
The S&P 500 (+0.82%) build on Tuesday’s exuberant rally, matching the 0.82% climb of the Dow Jones Industrial Average. The NASDAQ Composite added 0.64%, while the Russell 2000 underperformed, sliding 0.22% in the red.
The SPX was helped higher first and foremost by Real Estate (+2.28%), which roared back after uncharacteristically falling amid the rate cut outlook. The second-best performer was Utilities (+2.14%)—something that should keep investors on their toes: when defensive stocks rise, it suggests traders are not fully confident. Energy (-1.11%) tracked oil prices plunging into a bear market on a hefty build up in U.S. inventories—even as some expect crude could surge to $100 amid a growing U.S.-Iran conflict. The current lows in fact highlight a mismatch between fundamental headwinds and trader perception, according to some analysts.

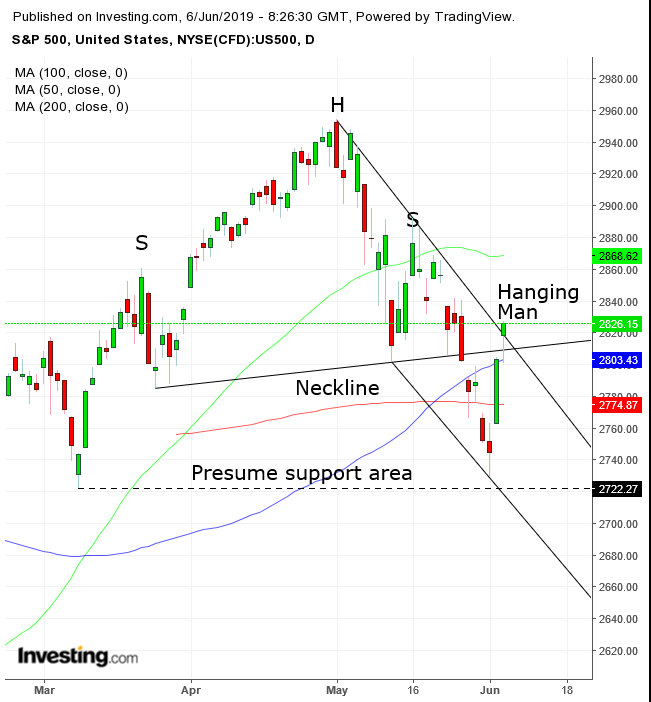
Technically, the SPX climbed above the neckline of a H&S top, putting into question the medium-term reversal it purported. However, it was stopped by the downtrend line since May 1, the head of the pattern. It also formed a hanging man, the first of a two-day pattern. If today’s prices close below the hanging man’s real body, it would suggest a short-squeeze in the making, pushing prices back down and confirming the resistance of the H&S neckline.

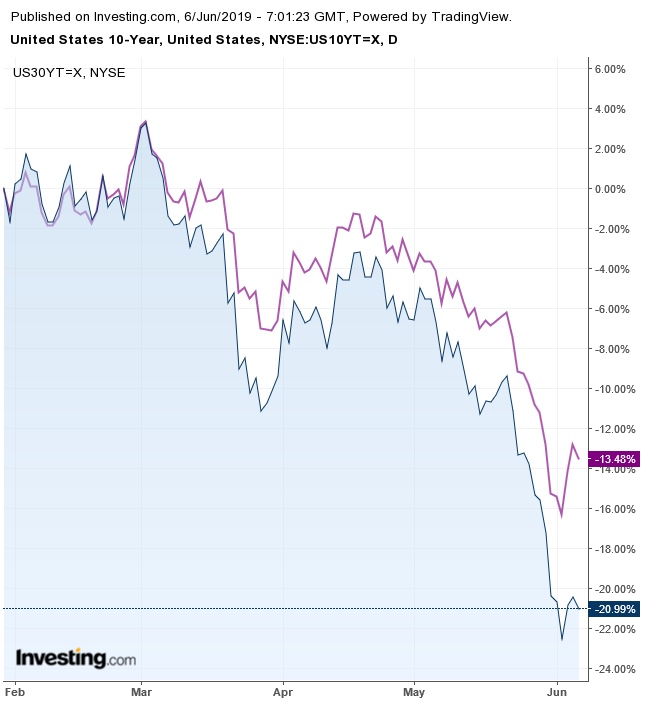
However, at the same time 10-year yields resumed their tumble, deepening the curve with longer-dated bonds, after the new jobs reading for April revealed U.S. companies added the fewest hirings in nine years. The standstill in jobs amid heightening trade tensions with Mexico is especially poignant, as tariffs on the southern neighbor could reportedly cost the U.S. 400,000 jobs.
Traders priced in rate cuts, creating a market paradox. On the one hand, the outlook of easing monetary policy boosted equities to their best performance since January on Tuesday, but on the other hand, the steepening yield curve increases the odds of a recession. Analysts from some global investment banks think the market priced in rate cuts prematurely. Either way, Tuesday’s exuberant rally on the interpretation of an accommodative Fed contradicts Friday’s selloff on expectations that the Fed will be forced to cut rates to support a contracting economy. These are vivid examples of colliding market narratives we forewarned on Monday.
In the FX market, the euro steadied against the greenback ahead of the European Central Bank’s policy announcement, with President Mario Draghi under pressure from markets to provide more stimulus, in line with a loosening shift among global central banks.
Up Ahead
Market Moves
Stocks
Currencies
Bonds
Commodities
