- U.S. futures, Europe follow Asia lower as recession warnings multiply
- Yields resume drop toward 2.00
- Gold strengthens on safe-haven rotation
Key Events
European stocks and futures on the S&P 500, Dow and NASDAQ 100 extended a selloff this morning as a global trade war intensified in the aftermath of U.S. threats, last week, to impose progressive tariffs on Mexican goods starting from June 10. China released a report over the weekend hitting back at the U.S.'s "unilateralism" and recent breaches in trade talks, prompting investors to return to safe-haven assets such as Treasurys, the yen and gold.
The STOXX 600 doubled Friday’s selloff in the first half-hour of the open, with oil producers and miners leading losses, and resumed to slide into the second half-hour of the session. Disappointing Eurozone manufacturing PMI added to downbeat data from Japan to re-awakened the specter of a global recession as a side effect of ongoing trade tensions. From a technical perspective, the pan-European index completed a Head-and-Shoulders pattern on Friday, mirroring indices in the U.S. and Japan. Today, the price broke through the 200 DMA, the most observed indicator even for fundamental investors.
In the earlier Asian session, all regional benchmarks closed lower except for South Korea’s KOSPI, which jumped 1.28% after Samsung's (KS:005930) Chairman Lee Jae-yong reportedly pressed the firm's top executives to refocus resources on the core business, as demand for computer chips and smartphones fell amid the U.S.-Sino trade war.
Australia’s S&P/ASX 200 underperformed (-1.19%). China’s Shanghai Composite dropped 0.30% after the Caixin factory Purchasing Manager’s Index showed a deteriorating manufacturing outlook, even as it slightly beat the 50.0 expectations, matching last month’s 50.2, coming to a standstill rather than to an outright slide.
Global Financial Affairs
On Friday, U.S. equities doubled weekly losses, capping the worst May performance since 2010 and the second-worst May results since the 1960s, as the S&P 500 erased $4 trillion.

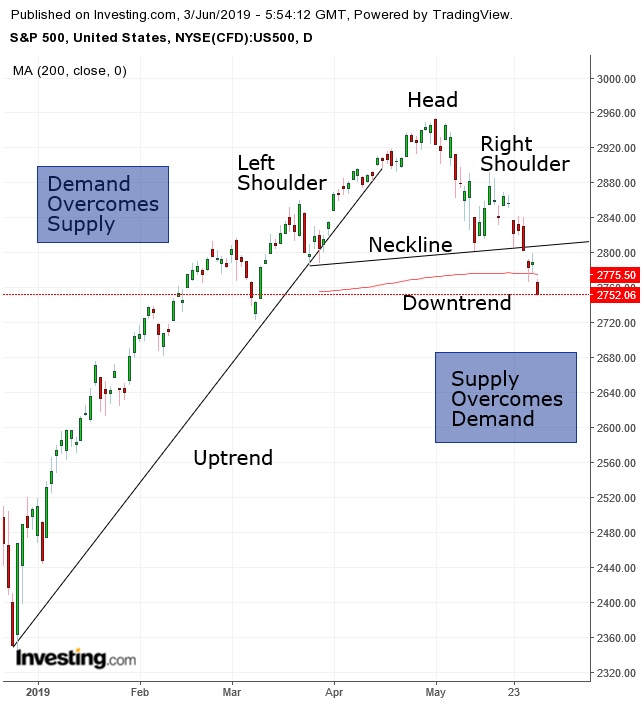
The S&P 500 (-1.32%) reversed course in the medium-term (weeks to months), from the uptrend since Christmas to a downtrend, after completing a H&S pattern, which shows how the market went from being demand-led to conditions where supply takes over. Also, after the H&S reversal, the price fell below the key 200 DMA.
And prices don't seem to be looking up any time soon. After stepping up his bid to curtail immigration from Mexico through higher trade tariffs, Trump also opened a new tariffs front targeting India. Thanks to its status as a developing country, the Asian country had so far been exempted from heavier duties.
If all that wasn’t enough, on Sunday China threatened to target FedEx (NYSE:FDX) in retaliation to the U.S. ban on Chinese telecom giant Huawei.
In response to heightened global trade pressure, analysts from investment banks including JPMorgan Chase and Morgan Stanley see stocks continuing their downward journey fall.
Bottom Line: The odds that shares will continue to trade in the downtrend over the next few weeks to months—till they reach the December levels, below 2,500.00—are much more likely than they would go up.

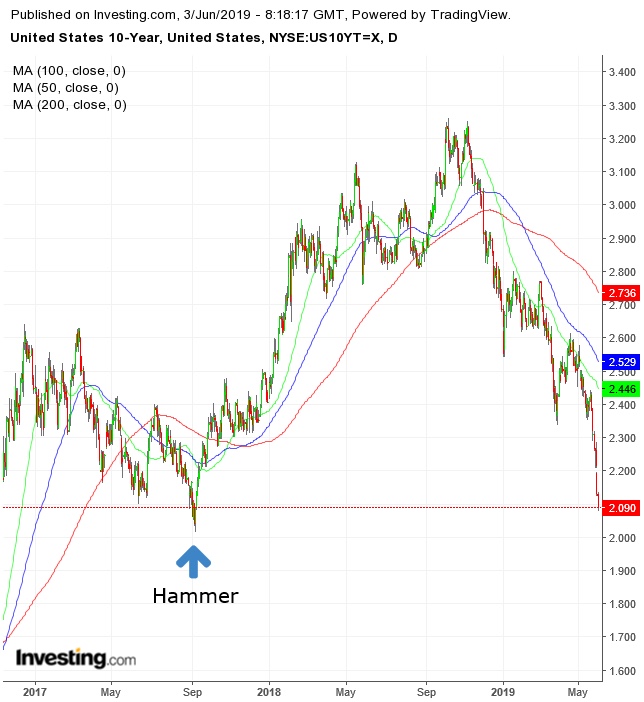
Meanwhile, the rising outlook for a recession, specifically for falling interest rates, have pushed yields on 10-year Treasurys to the lowest level since September 8 2017, which is the last support defending them from a drop to the lowest since 2016—before the Trump presidential win pushed yields to their highest level since 2011. Indeed the September 8 2017’s trading developed a bullish hammer, guarding the 2.00 psychological level. We expect volatility at these levels, as opposing market narratives collide.

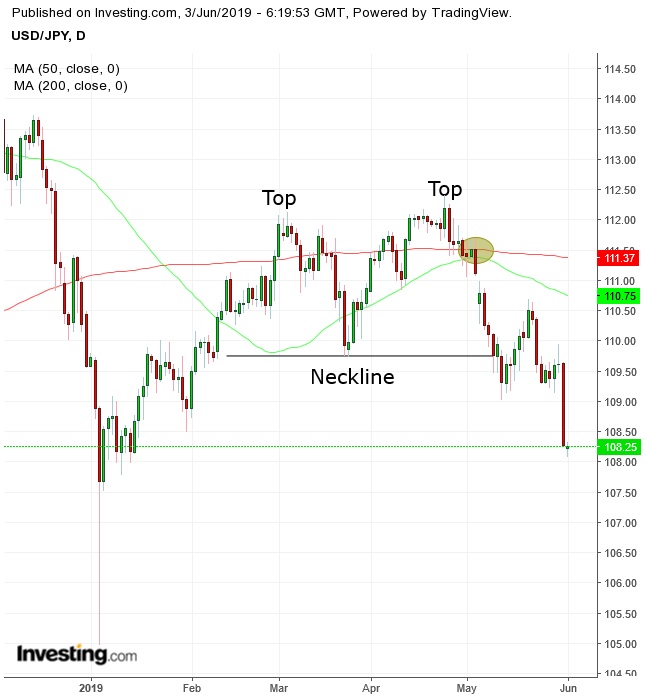
The yen continued to strengthen on its safe haven status—though it was seen mildly lower in the late European morning session—as plunging yields attract less foreign demand for U.S. Treasurys, pushing the dollar lower.
Gold is back in business against a weakening dollar and a drive to safety, blowing out a H&S top and establishing a short-term uptrend.

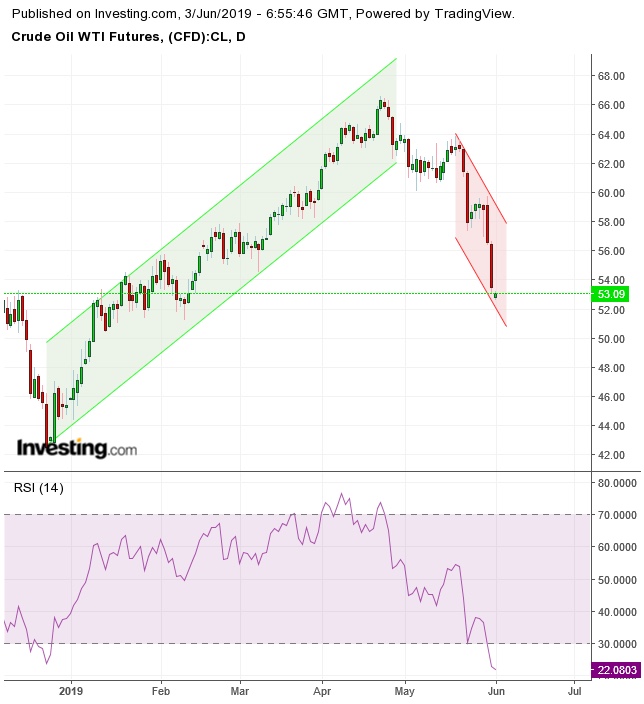
In the early session, oil resumed to slide, flirting with the $53.00 level. Recession risks painted a gloomy outlook for demand, outweighing supply disruptions expected from Iranian sanctions as well as threats from the Middle Eastern oil producer and thereby extending a downtrend. The RSI hit 20.00, the lowest level since November. However, WTI stood safely in green territory by late European morning.
Up Ahead
- The U.S. ISM manufacturing PMI is released on Monday.
- Also on Monday, U.S. President Donald Trump meets U.K. Prime Minister Theresa May in London.
- Tuesday sees the Reserve Bank of Australia policy meeting, with many expecting an interest-rate cut.
- China President Xi Jinping begins a two-day visit to Russia on Wednesday.
- Theresa May steps down as leader of the Conservative Party on Friday.
- Friday’s U.S. jobs report is projected to show payrolls rose by 190,000 in May, unemployment held at 3.6%, a 49-year low, and average hourly earnings growth sustained a 3.2% pace.
Market Moves
Stocks
- The Shanghai Composite Index declined 0.3%.
- The MSCI Emerging Market Index rose 0.5%.
Currencies
- The Dollar Index dropped 0.4%, paring a 0.11% drop.
- The euro was unchanged at $1.1169, the strongest in a week.
- The British Pound edged 0.1% higher to $1.2643.
- The onshore yuan fell less than 0.05% to 6.907 per dollar.
Bonds
- The yield on 10-year Treasurys dropped three basis points to 2.10%, hitting the lowest in about 21 months.
- The yield on 2-year Treasurys slid six basis points to 1.86%.
- Germany’s 10-year yield fell one basis point to -0.21%, the lowest on record.
- Japan’s 10-year yield gained less than one basis point to -0.093%.
Commodities
- West Texas Intermediate crude fell 1% to $52.95 a barrel, the lowest in 20 weeks.
- Iron ore slipped 2.7% to $95.73 per metric ton, reaching the lowest in more than two weeks.
- Gold gained 0.6% to $1,313.23 an ounce, the highest in almost 10 weeks.
