- U.S. futures, Europe rebound on Huawei ban's temporary relief
- Dollar climbs; gold, yen slip
- Defensive Utilities hit all-time high on Monday
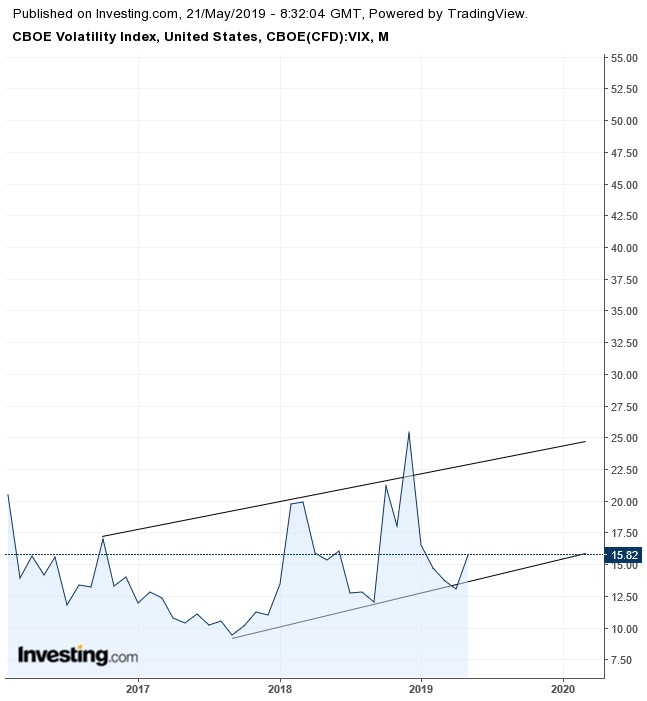
- VIX keeps pointing to more pain coming up
- Home Depot (NYSE:HD) reports Q1 earnings before market open on Tuesday. Some analysts are pointing out that the housing slowdown and weather headwinds will probably only mark short-term setbacks for the largest U.S. home-improvement retailer.
- Minutes from the April 30-May 1 FOMC policy meeting will be released on Wednesday.
- ECB President Mario Draghi speaks in Frankfurt on Wednesday.
- On Thursday, the ECB publishes its account of the April monetary policy decision.
- Counting of votes from the Indian general elections takes place on Thursday as Prime Minister Narendra Modi attempts to secure a second term.
- The European Parliament holds continent-wide elections on May 23-26.
- The U.K.’s FTSE 100 jumped 0.4%.
- Germany’s DAX gained 0.5%.
- The MSCI Emerging Market Index advanced 0.2%, the largest gain in more than a week.
- The MSCI Asia Pacific Index fell 0.2%.
- The Dollar Index gained almost 0.2%, to the highest since Apr. 25 and is trading at the top of the session.
- The euro decreased 0.1% to $1.1151, the weakest in almost four weeks.
- The British pound dipped 0.2% to $1.2702, the weakest in almost 20 weeks.
- The Japanese yen fell 0.1% to 110.16 per dollar, the weakest in two weeks.
- The yield on 10-year Treasurys was unchanged at 2.42%, the highest in more than a week.
- Germany’s 10-year yield climbed one basis point to -0.08%, the highest in a week.
- Britain’s 10-year yield gained one basis point to 1.067%.
- Italy’s 10-year yield increased one basis point to 2.709%.
- West Texas Intermediate crude climbed 0.6% to $63.48 a barrel, the highest in almost three weeks, on the effect of OPEC's commitment to output cuts. The next key date is June 25, when investors will find out whether the oil-producers cartel will bring supply cuts into the second half of the year.
- Gold fell 0.2% to $1,275.68 an ounce, the weakest in almost three weeks.
Key Events
Futures on the S&P 500, NASDAQ 100, Dow Jones and Russell 2000 climbed in unison this morning after the U.S. granted a 90-day limited license to Huawei to maintain and update existing networks and handsets. The move came after a ban on the Chinese telecom giant from the Trump administration sent ripples through global markets, pushing numerous tech firms to halt business with the company on Monday.
Contracts on the Dow made the biggest headway at the open, erasing most of yesterday’s losses, as stocks of export-reliant multinationals benefited from easing trade risk.
The STOXX 600 wiped out almost half of yesterday’s setback, with tech companies leading both today's rebound and Monday's declines.

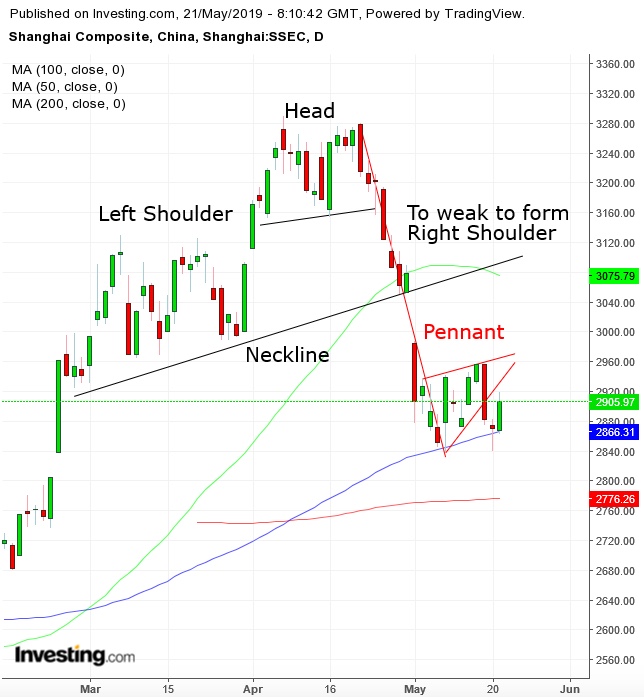
Earlier, in the Asian session, China’s Shanghai Composite (+1.23%) outperformed. However, a chain reaction might have already been set in motion on the index, causing continued declines, with the current rebound off the 100 DMA being stopped by the resistance of a bearish pennant. Such a scenario would fit with the fact that the index topped out with such a weak H&S top that it failed to garner enough demand to form a right shoulder.
Global Financial Affairs
U.S. stocks closed lower on Monday, after a tumultuous session. Trade headwinds drove markets lower after Google (NASDAQ:GOOGL) suspended Huawei’s Android license. Semiconductors led the declines.
The S&P 500 gave up 0.67%, for a total two-day loss of 1.25%, with Technology (-1.74%), Communication Services (-1.65%) and Materials (-1.43%) taking the brunt of the selling. Defensive stocks in Utilities (+0.14%) resumed their outperformance, hitting a new all-time high. However, their paltry advance relative to last week, and the sector’s inability to notch a record on a closing basis, suggests that investors are losing faith in equities altogether, throwing the baby out with the bathwater.
The Dow Jones Industrial Average edged 0.33% lower, even as its 100 DMA crossed above its 200 DMA, supporting a continuous medium-term uptrend despite the short-term rout. However, like the SPX, the Dow has been trading within a pennant-shaped congestion since May 8—a continuing pattern, which suggests continued downside risk. A downside breakout would push the price below those MAs and also undo the bullish cross.

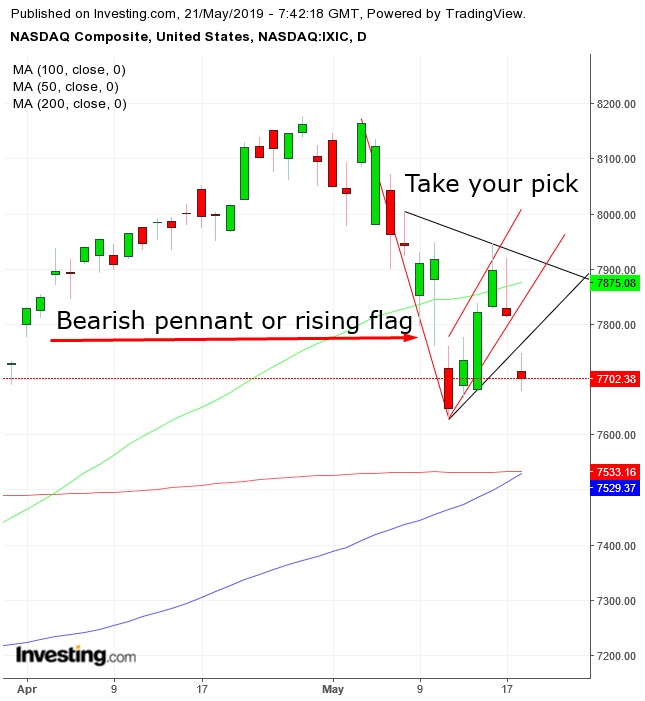
The NASDAQ Composite (-1.46%) saw its biggest decline in a week. The tech-heavy gauge may have completed either a pennant (black, converging trend lines) or rising flag (parallel, red rising trendlines), both bearish after this month's drop.
Meanwhile, the yield on 10-year Treasurys pared half of yesterday’s advance, in line with gains across European shares and U.S. futures, thanks to the relief provided on the latest trade headwind, however tenuous.
The dollar resumed an upside breakout of an ascending triangle, taking on the April 26 peak.
Gold fell on the strengthening dollar, resuming its descending channel after falling below the 50 DMA and crossing below the 100 DMA. The $1,266 level from the late April-early May lows is a presumed support area, confirmed by the 200 DMA. However, the Complex H&S top since the beginning of the year shows a lot more vested interest, with unwinding positioning favoring a bearish outlook.
The yen gave back much of yesterday’s advance as traders backpedaled into riskier positions, relying on the fickle trade narrative.

Overall, we expect volatility to continue rattling markets. CBOE contracts bottomed out tracking the equity route late last year, and their trajectory is up.
Up Ahead
Market Moves
Stocks
Currencies
Bonds
Commodities
