- Unpredictable trade negotiations leave investors on edge
- Bond yields fall to lowest since Dec. 2017, dollar climbs to near-May 2017 heights
- U.S. equities in a medium-term uptrend, but weakness persists
The S&P 500 fell for the second consecutive week as U.S.-China trade friction left investors cautious. The back-to-back weekly declines were the first since December's stock market bottom and may be a signal of more pain to come.
Treasurys closed out the week at their lowest level since early Dec. 2017. The dollar ended near its highest since May 2017.
Investors need to pay attention to the extreme levels of yields and dollars, as they not only predict rates, exports and the economy in general, but they may prove to be self-fulfilling prophecies. Investors will have to decide whether the yield curve, which inverted twice in the first half of the year even as equities reach new heights, is a recipe for disaster, or whether this time it’s different.
The S&P 500 fell 0.58% Friday, with all sectors but defensive Utilities (+0.51%) falling. Industrials (-1.11%) underperformed due to its reliance on exports. For the week, the popular gauge receded 0.76%, its second straight weekly decline. Technically, the price is resuming to trade according to a bearish Broadening Pattern, after closing below the 50 DMA, while remaining above the 50 WMA.
The Dow Jones Industrial Average receded 0.38 percent Friday and 0.69% for the week, its fourth consecutive weekly decline. Technically, the price found resistance by the 50 DMA Thursday, below which it remained Friday, while staying above the 50 WMA. The price might be forming a down-sloping H&S top on the weekly chart.
The Nasdaq Composite gave up 1.04% Friday and 1.27% for the week. This is also the second weekly loss. Technically, the tech-heavy index mirrored the MA interplay as did the previously mentioned indices. It is also forming a bearish Broadening Pattern as the SPX.
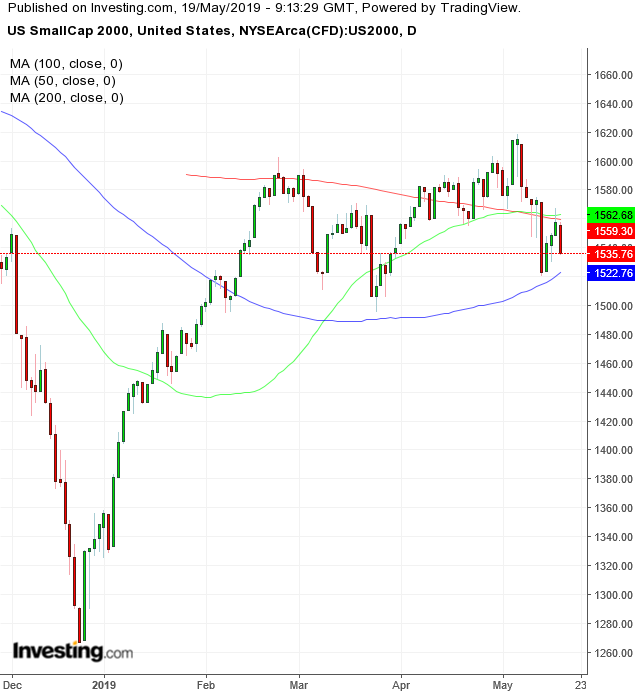
The Russell 2000 underperformed, dropping 1.27% Friday and 2.37% for the week. Technically, the price found resistance Thursday below the 50 and 100 DMA and proceeded to fall, wiping out two-and-a-half days of gains. Also, the 50 DMA crossed below the 200 DMA triggering a Death Cross. The price found support above the 100 DMA, which forms an organic neckline for a double-top.
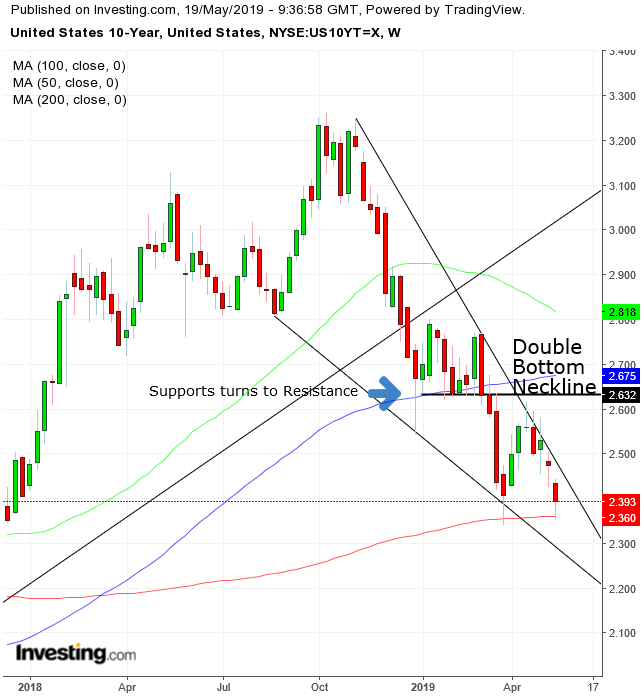
The renewed risk-off led investors to increase Treasury holdings, pushing yields to the lowest since early December. We have been consistently bullish on Treasurys, predicting that yields will continue to fall and it has been one of the reasons for our bearish stance on equities despite the rally since Christmas. If yields would fall below the 200 DMA, it would signal a continued downtrend, an omen for equities, especially after the second yield inversion this year, one of the most feared leading indicators. However, notice the falling wedge pattern rates have been developing since August. Should the 200 DMA prove to be a support, the price could complete a small double bottom, whose neckline – confirmed by the 100 DMA - is at 2.6, also completing a falling, bullish wedge. The fundamental scenario for this technical development would be the realization that there are several significant differences between the recent yield inversion and historical ones.
Current valuations are not disconnected from prices as they were during the dotcom bubble. The ongoing concerns over trade, tightening and economic data doesn’t paint a picture of irrational exuberance among company managers. Still, it’s impossible to know how trade negotiations will develop with a maverick U.S. president; how the Fed will proceed with its monetary policy after being outrageously inconsistent and the jury is still out on China’s economy. And then there’s the greenback.
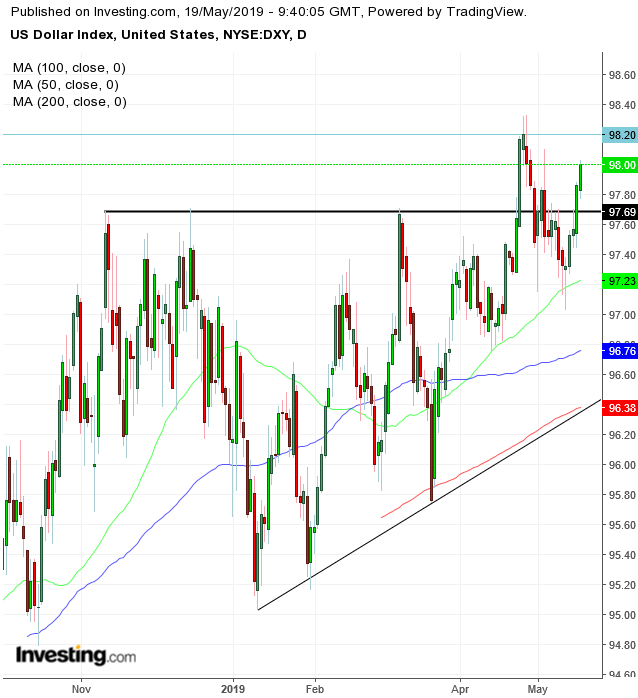
The dollar has returned above its ascending triangle, suggesting that its near-highest level since May 2017 is a prelude to higher peaks. A strong dollar hurts U.S. exports, especially in the current trade-sensitive environment.
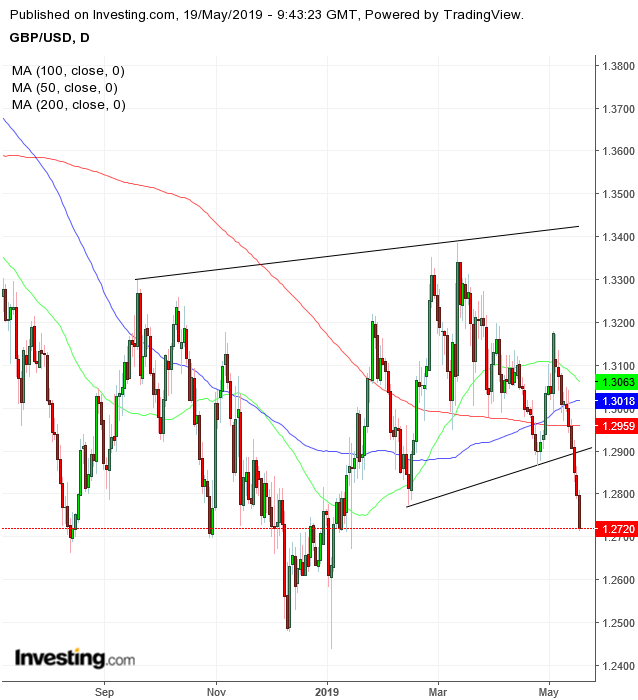
The pound weakened as U.K. Prime Minister Theresa May agreed to set a timeline to quit and Labour leader Jeremy Corbyn walked out of cross-party Brexit talks. Technically, the currency completed Wednesday a H&S top since January. However, considering it's still above the August and October lows, it can potentially turn around and complete a massive H&S bottom since September.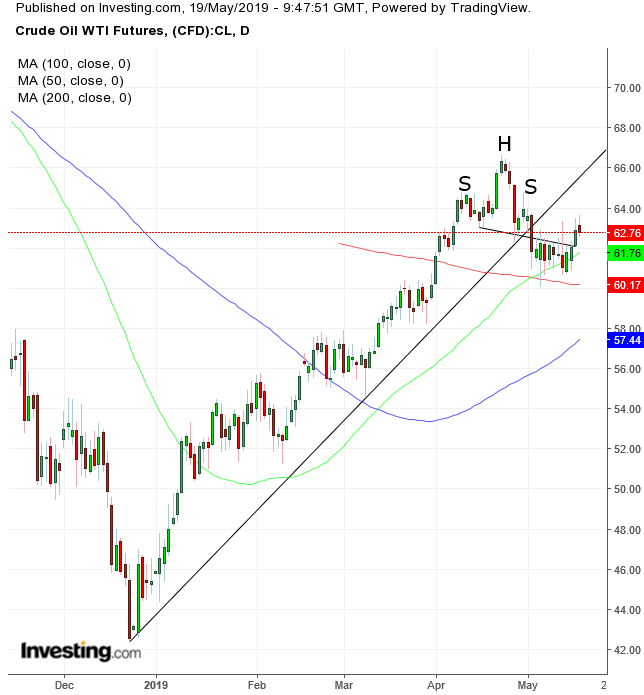
While Bank of America (NYSE:BAC) is very bullish on oil, investors are concerned that trade talks and tensions with Iran could adversely affect prices. Technically, while the price fell below its uptrend line since the December bottom, it found support by the 50 and 100 DMA after a golden cross. Also, a small, failed H&S top could serve as a continuation pattern.
Meanwhile, iron ore rose to the highest level in almost five years. Bitcoin slumped as much as 14%, before paring losses as this month’s surge for cryptocurrencies was tested.
Week Ahead
Sunday
19:50 – Japan GDP: expected to be -.01% from 0.5% QoQ
Monday
19:00 – U.S. – Fed Chair Powell Speaks: Will the chief reinforce his suggestion of a rate cut after declaring that “low inflation is one of the major challenges of our time?”
21:30 – Australia – RBA Meeting Minutes: Will the Australian Central Bank accept the advice of the National Australia Bank to cut rates to 1%?
Tuesday
4:30 – U.K. – BoE Gov Carney Speaks: Investors will listen for clues if Carney is considering raising rates after rising oil prices pushed inflation back above his 2% target
10:00 – U.S. – U.S. Existing Home Sales: expected to climb to 5.33 million in the month of April, from 5.21 million a month earlier
Wednesday
3:30 – U.K. – ECB President Draghi Speaks: crypto enthusiasts should pay close attention after the ECB’s paper opened the possibility of digital euro and how that might affect the crypto market
4:30 – U.K. CPI: expected to climb to 2.2% from 1.9% YoY
8:30 – Canada – Core Retail Sales: will likely rise to 0.8% from 0.6%
10:30 – U.S. – Crude Oil Inventories: analysts predict a fall to -0.800 million barrels
14:00 – U.S. – FOMC Meeting Minutes
Thursday
3:30 – Germany – German Manufacturing PMI: expected to have edged up to 44.8 from 44.4 MoM
4:00 – Germany – German ifo Business Climate Index: seen to have remained steady at 99.2, which should be a good sign after the recent pessimism
7:30 – EU – ECB Publishes Account of Monetary Policy Meeting
10:00 – U.S.– U.S. New Home Sales: probably declined to 678,000 from 692,000 for the month of April
Friday
4:30 – U.K.– U.K. Retail Sales: expected to fall to -0.4% from 1.1%
8:30 – U.S.– Core Durable Goods: likely to have dropped to 0.2% from 0.4%
