- U.S. futures, European shares waver amid upbeat Chinese data and trade signals
- Dollar, Treasury yields slip after Trump renews attack on Fed
- Oil slips below $64
- The Reserve Bank of Australia releases the minutes of its latest rate decision on Tuesday.
- China GDP, industrial production and retail sales data is coming up on Wednesday.
- Stock markets in countries including the U.S., U.K. and Germany will be closed for Easter holidays on Friday.
- Citigroup (NYSE:C) and Goldman Sachs (NYSE:GS) release their results before market open on Monday. United Continental (NASDAQ:UAL) and PepsiCo (NASDAQ:PEP) will also unveil their financial results later today.
- Bank of America (NYSE:BAC), BlackRock (NYSE:BLK), are due to report on Tuesday, alongside Alcoa (NYSE:AA), Johnson & Johnson (NYSE:JNJ) (NYSE:JNJ) and IBM (NYSE:IBM). Earnings results from the multinational IT group will be watched closed by investors for signs that the company's publicized turn-around is gaining momentum.
- Wednesday it's the turn of Morgan Stanley (NYSE:MS) (NYSE:MS), American Express (NYSE:AXP), Netflix (NASDAQ:NFLX) and Taiwan Semiconductor Manufacturing (NYSE:TSM).
- Honeywell (NYSE:HON) is due to publish its earnings report on Thursday.
- The MSCI Asia Pacific Index advanced 0.6%, the largest gain in more than a week.
- The MSCI Emerging Market Index climbed 0.1%.
- The Dollar Index dropped less than 0.05%.
- The euro rose 0.2% to $1.1316.
- The MSCI Emerging Markets Currency Index advanced 0.1% to the highest in more than three weeks.
- The South Korean Won increased 0.6% to the strongest in more than three weeks.
- The yield on 2-year Treasurys rose less than one basis point to 2.39%.
- The yield on 10-year Treasurys fell one basis point to 2.56%.
- Germany’s 10-year yield gained one basis point to 0.06%.
- Gold slid 0.2% to $1,287.47 an ounce, the weakest in more than five weeks.
- Brent crude declined 0.2% to $71.39 a barrel.
- Platinum dropped 0.9% to $890.50 an ounce, the lowest in more than a week.
Key Events
European stocks and futures on the S&P 500, Dow and NASDAQ 100 oscillated this morning after most Asian shares closed well off their highs or even at losses, despite positive economic data from China and upbeat earnings results from U.S. banks on Friday.

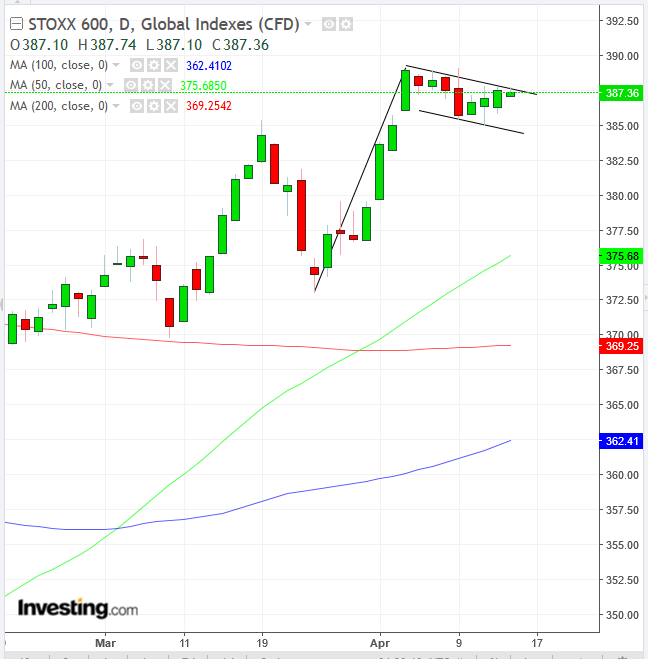
The STOXX 600 edged lower as gains in banking shares were offset by a slide in food and beverage stocks. However, the pan-European benchmark reversed to climb into green territory by the late European morning. Technically, the price of the index is trading within a falling flag—bullish following the 4% jump of March 25-Apr. 3.
In the earlier Asian session, regional equities staggered after racing toward 9-month highs as U.S. Treasury Secretary Steven Mnuchin and Chinese foreign ministry spokesman Lu Kang boosted hopes for an imminent trade deal, while exports and credit data from China came in higher than expected.

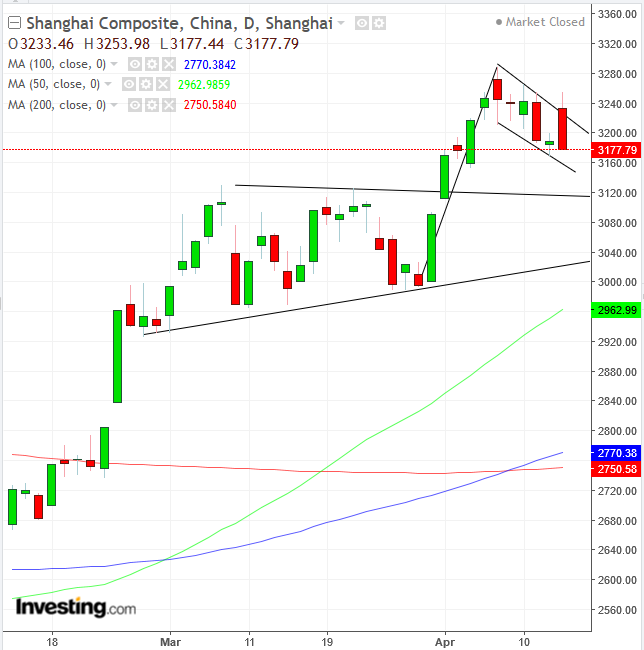
China’s Shanghai Composite (-0.34%) gave up a 2.05% surge, to close 1.06% away from the highest levels since March last year. Why would Chinese shares falter just when trade optimism is pointing higher? While as of the time of writing there were no known fundamentals to explain this counterintuitive move, technically we consider it a downward correction in the form of a falling flag—bullish following the 8.57% surge in the six sessions between March 29 and Apr. 8. That itself marked a return move to an upside breakout of an ascending triangle, after the major moving averages entered a bullish formation.
Hong Kong’s Hang Seng (-0.33%) also turned a 1.41% intraday high into a loss.
While South Korea’s KOSPI (+0.42%) closed at the highest levels since early October, a shooting star trading pattern opened the potential for a double top with February highs, right as the 50 DMA managed to crawl above the 200 DMA for a golden cross. The current resistance is formed by the July-October lows. After the double bottom formed in November-December, we are witnessing a titanic battle between bulls and bears for the medium- to long-term trends.
Australia’s S&P/ASX 200 traded between a 0.13% gain and a 0.20% slide, to close at neutral levels.
Japan’s Nikkei bucked the trend, scaling to a 4-month high as the falling yen—which hit the lowest levels for the year so far—boosted exports. Technically, the price opened 1.12% higher—disregarding the 200 DMA—bringing gains to 1.37% at the close.
Global Financial Affairs
On Friday, U.S. stocks jumped, sealing a three-week rally, with the S&P 500 coming within 1% of a new all-time high. Mega caps, however, underperformed.
After the International Monetary Fund reduced its outlook for global growth to the slowest pace since the financial crisis as a result of trade tariff headwinds, G-20 finance leaders lifted spirits by pointing to an increase in the global economic growth rate on the back of central banks' monetary easing.
Meanwhile, earnings beats from the likes of JPMorgan (NYSE:JPM) and Wells Fargo (NYSE:WFC) demonstrated that even rate-sensitive stocks could profit in this environment. Also increasing speculation the economy may be bottoming were signs that a batch of M&A activity is lining up in the energy sector—a major driver for inflation—after Chevron (NYSE:CVX) confirmed it will acquire Anadarko Petroleum (NYSE:APC) in a giant $33 billion deal on Friday.
Yields on 10-year Treasurys struggled to gain traction and the dollar dropped for a second day after U.S President Donald Trump resumed his attack on the Fed, blaming it for the lack of a better stock market performance. Technically, the greenback fell toward the bottom of a potential bullish pattern—a falling flag—as bulls gear up to conquer the March 7 high.
Oil fell below $64, to the bottom of a five-day range. Investors are also trying to gauge Russia’s reported reluctance to commit to further production cuts, amid mounting concerns that high oil prices will hurt global demand.
Up Ahead
Earnings
Market Moves
Stocks
Currencies
Bonds
Commodities
