- Global stocks, US futures experienced worst month in six years during October though they finished on an upbeat note
- Dollar reaches year high
- US Treasurys, gold and yen drop on stronger dollar
- General Electric slumps to 10-year low; Facebook, Take-Two Interactive and Under Armour spike on earnings results
- Apple is expected to report Q4 2018 EPS of $2.78 tomorrow, up from $2.07 during the same quarter last year
- Exxon Mobil (NYSE:XOM) is scheduled to post corporate results before market open on Friday, with an EPS forecast of $1.21, from $0.93 last year.
- The Bank of England in holding its monetary policy meeting on Thursday.
- On Friday, the last US jobs report before the November 6 mid-term elections is expected to show that hiring improved and the unemployment rate held at a 48-year low.
- Futures on the S&P 500 advanced 0.5 percent, to the highest level in more than a week.
- The STOXX Europe 600 climbed 1.1 percent to the highest level in more than a week on the biggest climb in more than two weeks.
- The UK’s FTSE 100 gained 1.2 percent to the highest level in three weeks.
- Germany’s DAX climbed 1.1 percent to the highest level in more than a week.
- The MSCI Asia Pacific Index ticked 1.5 percent higher to the highest level in a week on the largest increase in almost three weeks.
- The MSCI Emerging Market Index edged 1.4 percent higher to the highest level in a week on the biggest increase in almost three weeks.
- The Dollar Index climbed less than 0.1 percent to the highest since mid-2017
- The euro inched 0.1 percent higher to $1.1354.
- The British pound gained 0.2 percent to $1.2728, the largest gain in more than a week.
- The Japanese yen advanced 0.1 percent to 113.07 per dollar.
- The yield on 10-year Treasuries climbed two basis points to 3.14 percent, the highest in more than a week.
- Germany’s 10-year yield gained two basis points to 0.39 percent.
- Britain’s 10-year yield gained three basis points to 1.431 percent, the largest gain in more than a week.
- The spread of Italy’s 10-year bonds over Germany’s declined eight basis points to 3.0278 percentage points.
- WTI crude climbed 1 percent to $66.82 a barrel, the largest climb in four weeks.
- Gold gave up 0.5 percent to $1,216.29 an ounce, the weakest level in three weeks on the biggest dip in more than three weeks.
Key Events
European shares followed Asian stocks higher this morning and futures on the S&P 500, Dow and NASDAQ 100 built on yesterday’s rally, striking a positive note at the end of what is set to be the worst month for markets in at least six years. The dollar continued to edge higher—though it slipped into negative territory in the late European morning session—at the expense of gold and the yen, while US Treasurys also kept sliding lower.
The STOXX Europe 600 opened higher with every sector in the green, after Japan’s Nikkei 225 outperformed its Asian peers, which also sealed gains across the board for regional markets.
Global Financial Affairs
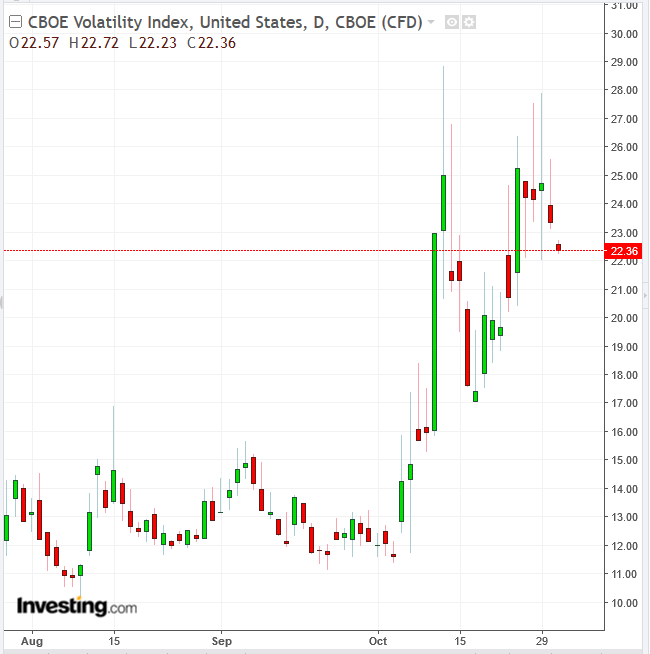
In the previous session, all US majors closed 1.5 percent into positive territory, or higher. Volatility also showed signs of abating, falling for three out of five session after the spikes seen since the start of the earnings season—though we have reasons to believe that, absent a substantial breakthrough in the US-China trade dispute, the indicator will get worse before it gets better.
The S&P 500 managed to climb 1.57 percent in the final hour of trade, after a tug-of-war between buyers and sellers. All 11 SPX sectors pushed over a full percentage point higher, except for Utilities (+0.39 percent). Communication Services outperformed (+2.73 percent), followed by Materials (+2.29 percent) and Industrials (+2.06 percent)—the sectors that are most sensitive to global trade headwinds.
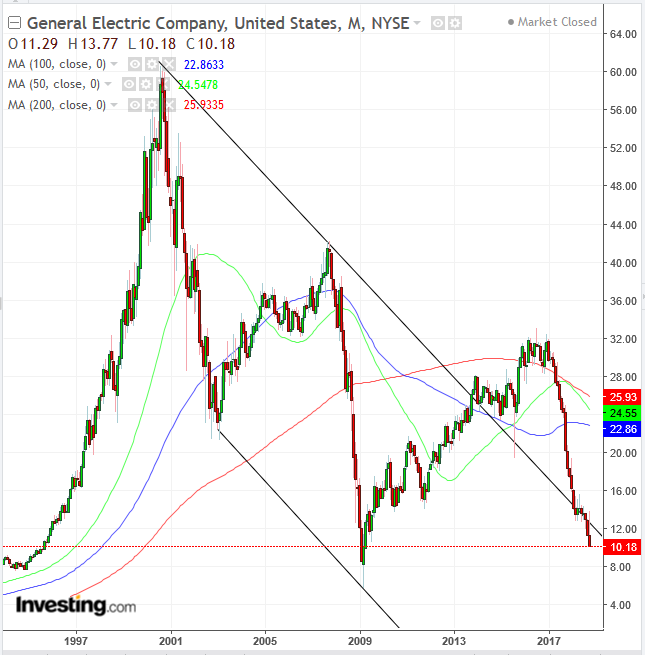
General Electric (NYSE:GE) plunged 8.78 percent, losing almost a fifth of its value over the last five sessions, falling to its lowest level since the aftermath of the 2008 financial crash. Investors got rid of the stock after the company slashed its historic 119-year-long dividend to one cent on Tuesday. Technically, the price of the stock fell for a third straight month, returning below a downtrend since the pre-2000 tech crash.
The Dow Jones Industrial Average climbed 1.77 percent and the NASDAQ Composite snapped up a 1.58 percent gain, with Facebook (NASDAQ:FB) gaining ground in after-hours trading following its upbeat earnings report. Take-Two Interactive (NASDAQ:TTWO) and Under Armour (NYSE:UA) also surged on strong results.
The Russell 2000 outperformed its peers, closing 2.06 percent higher.
Investor attention remains on earnings, economic data, political developments on the trade war front and rising interest rates.
Apple's (NASDAQ:AAPL) corporate results, due on Thursday after the close, are set to be closely watched by traders as a barometer of US corporate strength. Nonfarm payroll data, out on Friday, may also give analysts and investors more information on the trajectory of both US economic expansion and the cost of borrowing—with the latter having eased lately thanks to the recent Treasury yield drop from the month’s high of over 3.250.
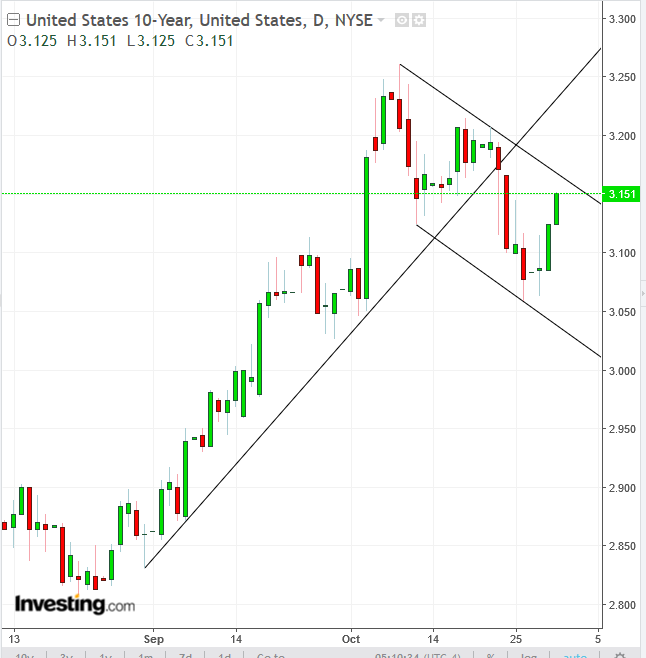
After a third-day rebound above 3.150, yields on 10-year notes are coming up against the resistance of the channel top, developed after the fall from 3.261 since October 9.
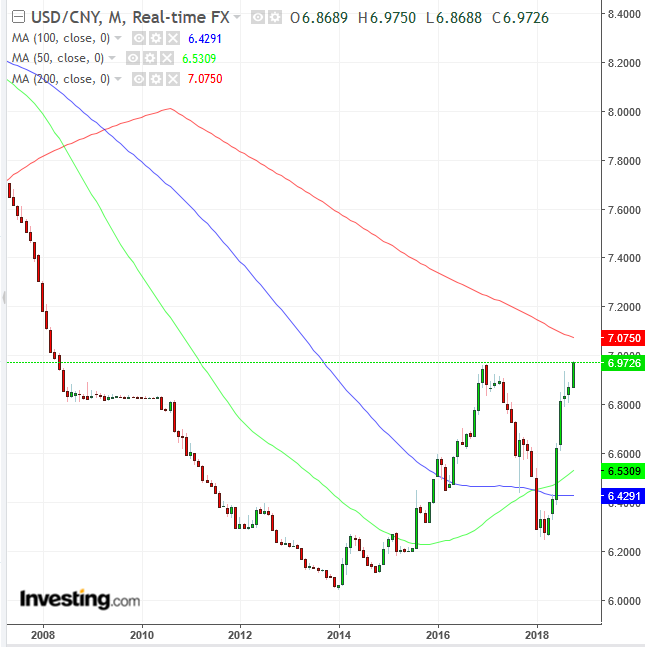
China’s overnight repo rate surged the most in over four years this morning, as local officials took steps to counter bets against the yuan, which held near the weakest level against the dollar for the currency since May 2008. We have recently argued that a USD/CNY climb over the January 2017 peak below 7.000 would elicit a strong response from US President Donald Trump, escalating the trade war. As it stands, the yuan selloff over the past month has wiped out $8 trillion off global stock markets.
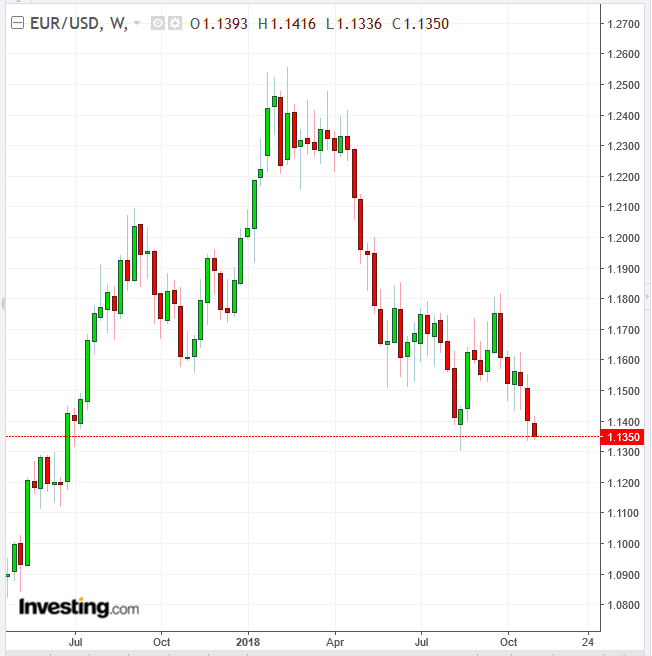
The euro is struggling to stay above the lowest level in 16 months, with the EUR/USD pair currently hovering around the 1.135 level.
The yen edged lower as the Bank of Japan left its monetary stimulus unchanged and kept its 10-year bond yield target at about zero percent, forecasting the country's economy will not hit the bank's inflation target for years to come.
Up Ahead
Market Moves
Stocks
Currencies
Bonds
Commodities
