-
European equities follow Asian shares lower, as disappointing earnings results and rising bond yields lure investors away from stocks
-
Technology shares resume selloff, potentially forming a top
-
Dollar bottoms out on an intraday basis; sterling bucks the trend
-
Alphabet, Caterpillar and Halliburton report earnings
-
French President Emmanuel Macron begins a three-day visit to the US on Monday
-
US manufacturing and services PMIs will be released later today
-
Later this week, US GDP and weekly jobless claims will be reported
-
Corporate earnings reports continue on Monday: Alphabet (NASDAQ:GOOG) is scheduled to report earnings for the fiscal quarter ending March 2018 after today's close; EPS consensus is $9.21 vs $7.73 for the same quarter last year; Caterpillar (NYSE:CAT) is expected to report earnings for the same fiscal quarter before the open, with an EPS consensus of $2.11. EPS result for the same quarter last year was $1.28; Halliburton (NYSE:HAL) also reports earnings before the open, with $0.41 EPS forecast, versus $0.04 for the same quarter last year.
-
Thursday, the European Central Bank decides on interest rates. While no change to either rates or the pace of asset purchases is expected, investors will watch for any sign that policymakers are preparing to taper stimulus at the next meeting, in June.
-
The Bank of Japan announces its latest policy decision on Friday and releases a quarterly outlook report.
-
The STOXX Europe 600 fell 0.2 percent as of 8:09 a.m. London time, the largest fall in a week.
-
The MSCI World Index dropped less than 0.05 percent to the lowest level in more than a week.
-
The MSCI Asia Pacific Index fell 0.2 percent.
-
Japan’s Nikkei 225 slid 0.3 percent, the biggest loss in more than a week.
-
The MSCI Emerging Market Index sank 0.4 percent to the lowest level in a week.
-
The UK’s FTSE 100 fell less than 0.05 percent, the first retreat in a week.
-
Futures on the S&P 500 Index climbed less than 0.05 percent.
-
The Dollar Index increased 0.15 percent, reaching the highest in almost two weeks on its fifth straight advance.
-
The euro fell less than 0.05 percent to $1.2286, the weakest in more than two weeks.
-
The British pound gained 0.2 percent to $1.4026, the first advance in a week.
-
The Japanese yen dipped 0.2 percent to 107.84 per dollar, the weakest in 10 weeks.
-
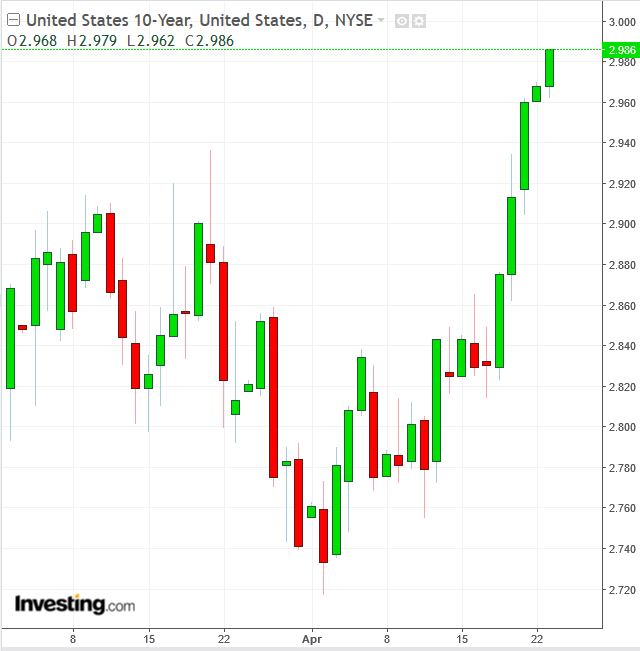
The yield on 10-year Treasuries rose two basis points to 2.98 percent, reaching the highest in more than four years on its sixth straight advance.
-
Germany’s 10-year yield climbed four basis points to 0.63 percent, the highest level in six weeks.
-
Britain’s 10-year yield increased four basis points to 1.518 percent.
-
WTI crude fell 0.4 percent to $68.14 a barrel, the largest fall in a week.
-
Gold fell 0.1 percent to $1,333.80 an ounce, the weakest in more than two weeks.
Key Events
Hopeful traders bid up US futures earlier today—including NASDAQ 100 Futures, whose tech shares have been selling off on the US-China trade spat—during the last few hours of Asia trade, even as regional stocks were sold off. However, things quickly reverted after the closing bell rang, with Asian indices, which were thoroughly in the red, finally denting global investor sentiment.
US futures on the S&P 500, Dow and NASDAQ have been falling for three straight hours at the time of writing, as investors appear to be forfeiting their chance to start the week on an up note and instead fell back into the risk-off mood that permeated markets during the second half of last week.
Disappointing forward guidance from UBS (SIX:UBSG), Switzerland's largest bank, spurred this morning's European selling. UBS shares lost 3.8 percent.
Asian bourses opened mixed, as investors assessed the outlook for trade and geopolitical risk. All key benchmarks, from Japan's TOPIX to China's Shanghai Composite, to Hong Kong's Hang Seng, to South Korea's KOSPI and Australia's S&P/ASX 200 then started sliding, with technology shares in particular weighing on the MSCI Asia Pacific Index, indicating that trade worries are still front and center for investors.

10-Year Treasury yields have now crossed 2.98, hitting the highest levels since the beginning of 2014, as investors swapped consumer staple stocks—which typically serve as bond proxies thanks to their high dividends and stable growth—for actual bonds. The uptrend in US Treasurys is also pushing global bond yields higher.
Global Financial Affairs
While US Consumer Staples lost 1.67 percent on Friday, the Technology sector was the second worst performer, falling 1.39 percent. Indeed, Financials) were the only sector in the green (+0.11 percent) as the week came to a close. As such, both growth and defensive stocks were sold off on mounting fears of higher interest rates.

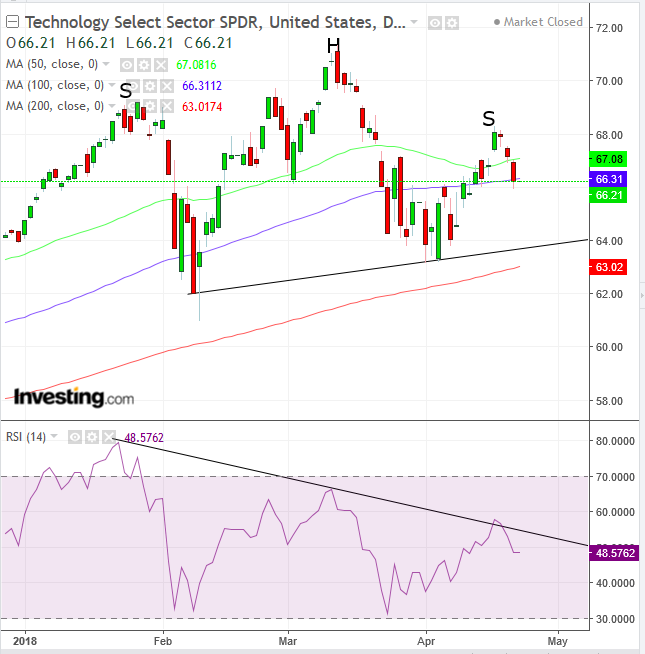
Technically, Friday’s selloff appears to be forming the right shoulder of an H&S top. Note that, while the price broke the 50 and 100 DMAs, the 200 DMA coinciding with the H&S neckline is significant. Also, the RSI provides a negative divergence. As opposed to the price, when it advanced with the head, momentum slowed down, suggesting prices will follow the lack of momentum lower.

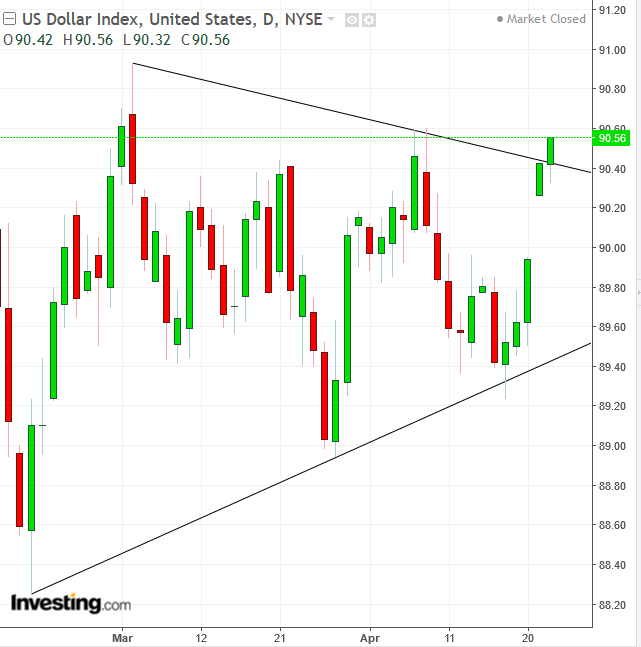
The dollar gained against other major currencies, as higher Treasury yields boosted global demand. Technically, the price of the Dollar Index provided an intraday upside breakout of a symmetrical triangle, suggesting a bottom—something bulls have been constantly seeking since 2017's 9.8 percent decline, with a total decline of 14.9 percent from the 103.82, January 2017 high to the 88.25 low of February this year.
The safe haven yen also dropped against the dollar, even as the risk-off wave sparked by equity plunges extends into the new week.
The pound bucked the trend. It managed to tick higher against a backdrop of growing political headwinds, as UK Prime Minister Theresa May risks losing support from Conservatives MPs over trade disputes with the EU.
The stronger greenback made USD-denominated oil suddenly too expensive, prompting traders to take profits and/or short the commodity. This follows two weeks of gains which were prompted by the renewed commitment of OPEC members to production limits.

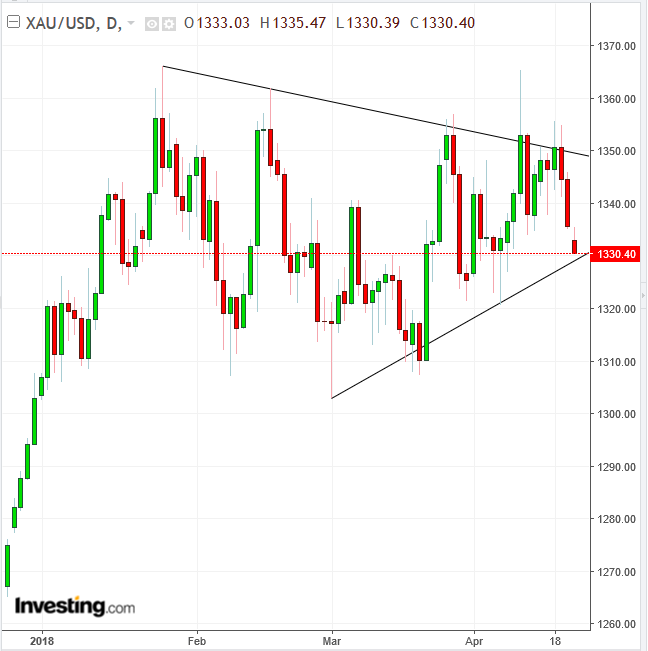
Gold slipped, weighed down by the stronger dollar, testing the lower boundary of its own symmetrical triangle. A downside breakout—brought on by continued USD strength—would increase the probability of momentum pushing gold toward the $1,240 levels.
Up Ahead
Market Moves
Stocks
Currencies
Bonds
Commodities
