Trend Model signal summary
Trend Model signal: Neutral
Trading model: Bearish
The Trend Model is an asset allocation model which applies trend following principles based on the inputs of global stock and commodity price. In essence, it seeks to answer the question, "Is the trend in the global economy expansion (bullish) or contraction (bearish)?"
My inner trader uses the trading model component of the Trend Model seeks to answer the question, "Is the trend getting better (bullish) or worse (bearish)?" The history of actual (not backtested) signals of the trading model are shown by the arrows in the chart below. In addition, I have a trading account which uses the signals of the Trend Model. The last report card of that account can be found here.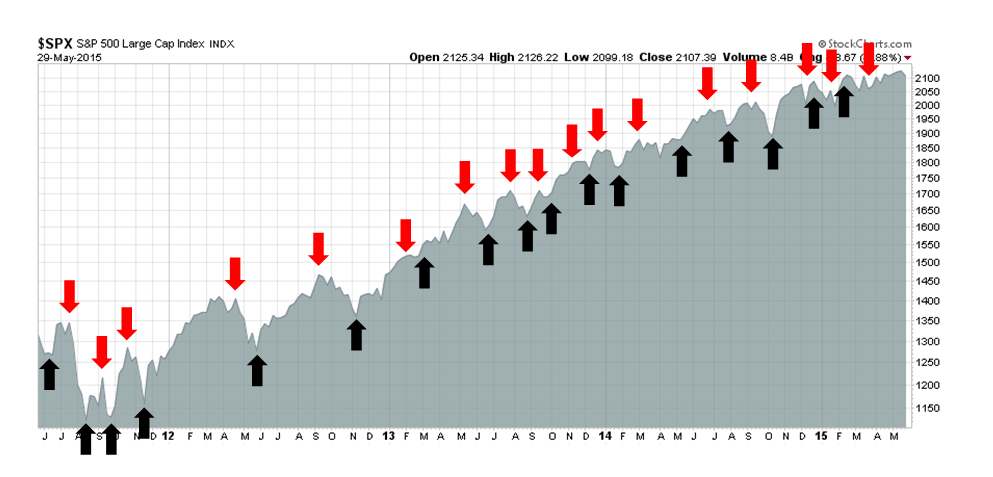
Update schedule: I generally update Trend Model readings on weekends and tweet any changes during the week at @humblestudent.
Explaining my SPX 1750 price target
I got a lot of feedback from my post last week, in which I postulated an approximate S&P 500 downside target of 1750 (see A very tired bull). While most of it was negative (more on that later), it did raise the question of where that figure came from.
To recap what I have been saying for the past few months, (for a summary see Why I am bearish (and what would change my mind)), the technical picture of the US equity market indicates that it appears to be forming an intermediate term top, Stock market history tells us that 10% corrections happen on a regular basis, sometimes for no macro or fundamental reason at all (see The Ebola correction? OH PUH-LEEZ), but the elements of a major bear market do not appear to be in place.
On the other hand, we have seen no SPX 10% pullback since 2011. With technical conditions deteriorating, the market is ripe for a decline. While a 10% correction might be par for the course, the intermediate term technical picture was suggestive of something more, either a substantial pullback (10-20%) or a major bear market. Major bear markets tend to be characterized by excessive valuations and recessions. While the American economy appears to be going through a soft patch, the risk of a full-blown recession remains low. That leaves the 10-20% pullback as the most likely and default outcome and my 1750 SPX target, or an 18% decline, is in that ballpark.
However, deeper 10-20% declines generally require a macro or fundamentally driven trigger. We just don`t know what that trigger is, but I will explore some possibilities later in this post.
Technical conditions continue to deteriorate
I don`t want to repeat myself so I will summarize the weak technical conditions that I have been seeing for the last few months.
US stocks have gone up in a straight line with only minor pullbacks since 2011. James Paulsen of Wells Capital Management said that the steady nature of the advance has been breeding investor complacency. In a further study, I found that the combination of a strong long-term trend and a weakening short-term trend could be characterized as a market trend becoming "overbought" but losing momentum. Using monthly DJIA data going back to 1900, I found that such conditions tended to resolve themselves bearishly. Current conditions are similar to long and short-term trend readings seen at the top, before the market crashes of 1929 and 1987 (see How to make your first loss your best loss).
The loss of momentum that I described can be graphically depicted by the deterioration in the MACD histogram, which has declined from a positive to a negative reading (bottom panel), In the last 20 years, this indicator has had a 100% accuracy of either calling a bearish episodes or was coincidental with bearish episodes.
A model with 100% accuracy is bearish 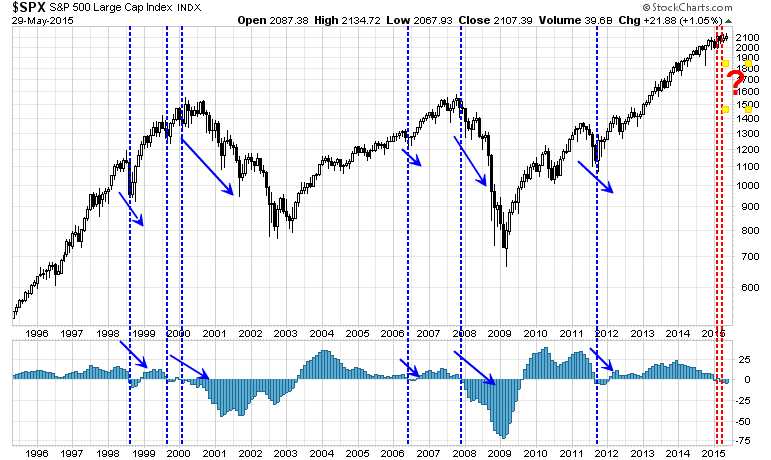
In addition, I have detailed problems with market breadth (see What apples-to-apples market breadth is telling us), which are intermediate-term market indicators.
Since I have written those words, more cracks have appeared in market internals. Most worrisome is the fact that credit market risk appetite seems to be rolling over. The chart below shows that the relative price performance of High Yield (blue, top panel, via the iShares iBoxx USD High Yield Corporate Bond ETF (ARCA:HYG) and the iShares 3-7 Year Treasury Bond ETF (ARCA:IEI)), Investment Grade Corporate (green, top panel via the iShares iBoxx USD Investment Grade Corporate Bond ETF (ARCA:LQD) and the iShares 7-10 Year Treasury Bond ETF (ARCA:IEF)) and Emerging Market bonds (via the iShares JPMorgan (NYSE:JPM) USD Emerging Markets Bond ETF (NYSE:EMB)), all of which have turned down when compared to Treasuries of equivalent duration.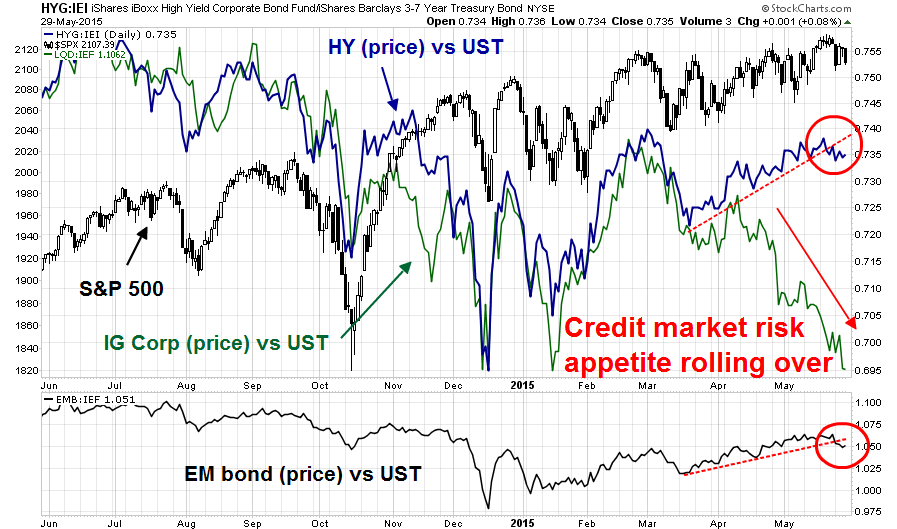
This across-the-board loss of risk appetite evident in the credit markets is another worrisome sign from an inter-market analytical viewpoint. As a reminder of the importance of the credit markets, recall James Carville's wish to be reincarnated as the bond market so that he could scare everybody.
Sentiment: Ready to stampede?
A glance at sentiment indicators are also suggestive that stock prices are poised to fall. Jason Goepfert pointed to the extended nature of the ratio of equity to money assets and the surge in the ratio in April as a contrarian bearish signal: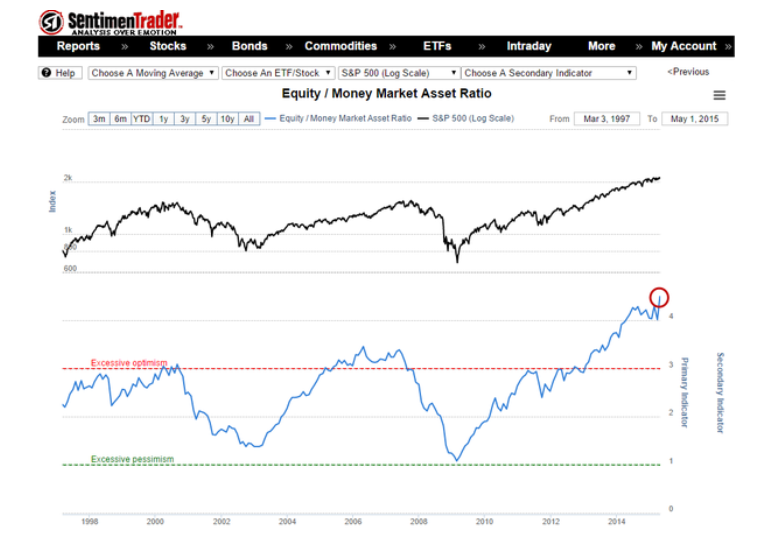
Goepfert also highlighted how available cash in NYSE margin accounts keeps falling to record lows: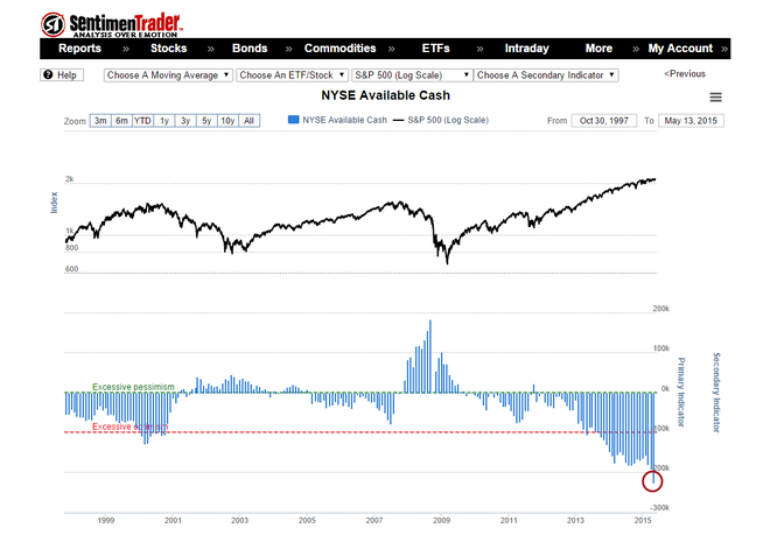
In addition, Mark Hulbert warned about the short-term vulnerability of stock prices, based on his survey of NASDAQ market timers.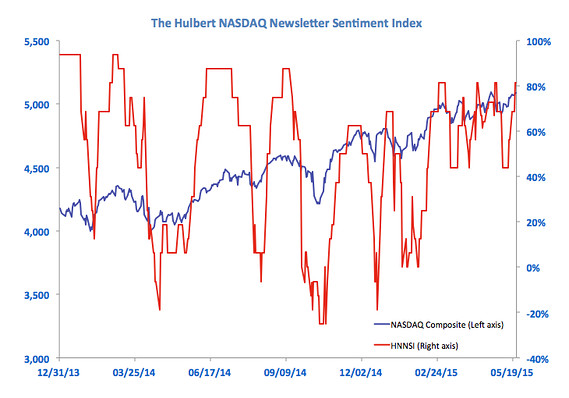
To be sure, the latest BoAML Fund Manager Survey indicates that fund managers are very underweight US equities. From a contrarian viewpoint, such a position could put a floor on US stock prices, should they decline.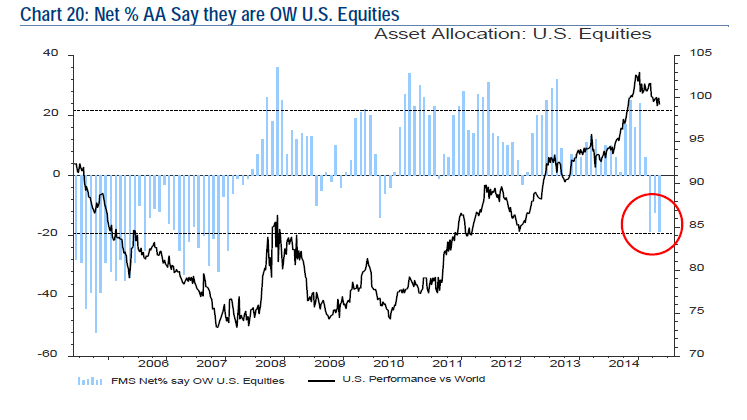
I would point out, however, that the BoAML Fund Manager Survey sample is tilted towards institutional managers with global mandates. The most recent data from State Street, which is a major custodian of institutional funds, shows that managers are highly weighted in equities (via Sober Look):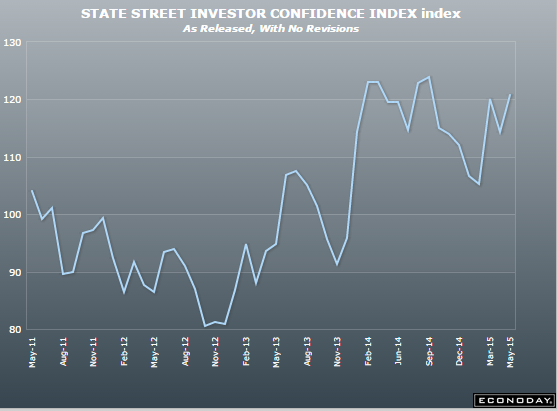
At an anecdotal level, I am detecting a high degree of denial that stock prices can go down. I received a lot of negative comments from my post last week (see A very tired bull, link above). While I am appreciative of constructive comments in the form of "I disagree with your analysis because you didn`t correct for this factor or you missed that factor...", I encountered a level of personal attacks and venom which was nothing short of astounding. Much of the tone was of the ilk, "You`re an idiot, you`re wrong and you`ve been wrong for the last few weeks".
What caused all this hate? Did I declare I worship the Devil? Did I deny the Holocaust? Did I kill a baby rabbit on the radio?
No. I said that stock prices would go down! The table below from A Wealth of Common Sense shows the kinds of losses that a buy-and-hold US equity investor should expect. Is it such a crime to suggest that a 10-20% loss could be expected after such a prolonged bull phase that has not seen a 10% correction since 2011? Do these people think that stocks are a one-way bet and anyone who questions that paradigm is an idiot? Not only did these comments reflect a lack of emotional maturity, but market maturity which recognizes that stock prices can go up as well as down.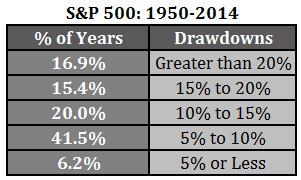
Despite the noise inherent in sentiment models, one of the most enduring messages I have seen is the level of uncertainty that is evident. I interpret this to be indicative of a jittery market that could stampede. Consider the record high levels of AAII neutral opinions (via Callum Thomas). 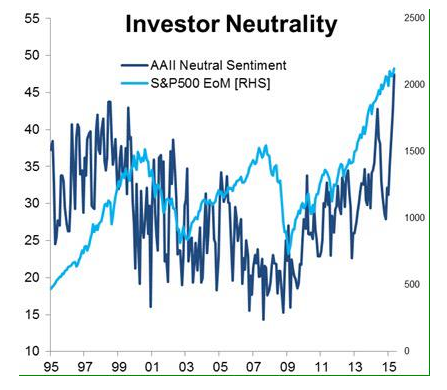
In summary, sentiment models are tilted bullishly, which is contrarian bearish. However, there is a great deal of uncertainty. If a bearish trigger were to appear, it has the potential to start a selling stampede.
In search of the bearish trigger
Today, the most common attitude seems to be everything is fine and you should own stocks. Should a stampede start and stock prices go down 10-20%, then you will be highly hesitant about buying them at the bottom. For that to happen, we need a macro or fundamental trigger.
One of the lessons learned from recent market history is that bearish triggers can come out of nowhere. A backup in Bund yields was not in my top 10 list of worries, but it managed to spook the markets. With that in mind, here are my top three most likely bearish triggers, in order of likelihood, with the least likely (China) verging into Zero Hedge and tinfoil hat conspiracy theory territory:
- US growth scare, combined with Fed tightening
- Greek default
- China
US growth scare
The current picture of the US is an economy that is nearing stall speed. While Q1 weakness could be dismissed as weather related, we are now seeing data from the Spring - and those data releases remain on the weak side. The latest Atlanta Fed GDPNow estimates of Q2 growth appears to have stabilized at the 0.7% to 0.8% level, which is consistent with New Deal democrat's observation that the US is in a mild industrial recession:
The parttern that has existed since mid-February of awful industrial data and poor consumer spending, but good comparisons for everything else, is firmly intact.
The latest update from John Butters of Factset show that consensus EPS estimates revisions to be roughly flat, with FY2015 rising and FY2016 falling. More worrisome is Factset's report that with Q1 Earnings Season more or less complete, the revenue beat rate came in at an abysmal 45%. Ed Yardeni also observed that forward revenue estimates are falling, though his estimates of forward EPS estimates are rising.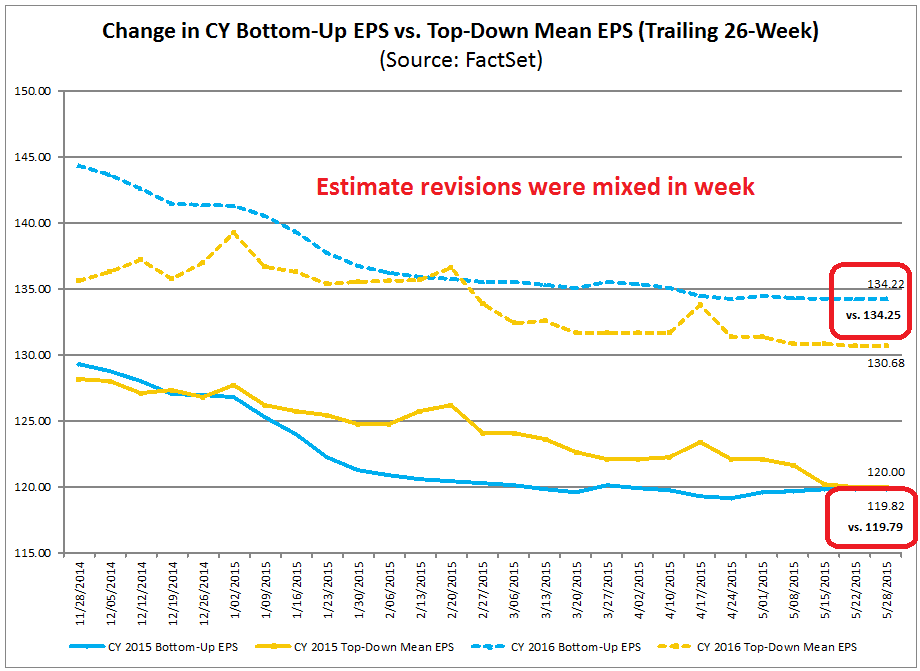
Combine those wobbly conditions with a round of Fed tightening and we have weak EPS growth and rising interest rates - which are exactly the elements of a stock market downturn. With employment growth still relatively robust, it would be not be hard to imagine a series of NFP releases that show employment growth above expectations and rising wage pressures, or a mini-stagflation episode.
Indeed, the latest Financial Stability Review from the European Central Bank fretted about what might happen when the Fed starts to raise rates. The combination of illiquid markets (remember the recent Bund market selloff), a crowded long in risky assets and financial leverage, especially in the shadow banking system, could set off a stampede for the exits.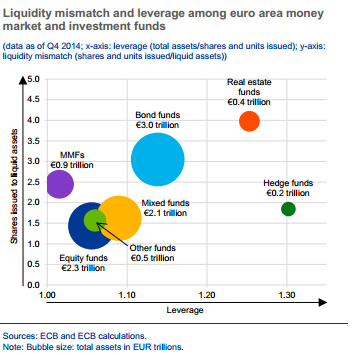
Greece: Time to cry wolf again?
Raise your hand if you`re tired of the Greek drama. Like the story of the boy who cried wolf too many times, this may be the time that the wolf finally appears but the villagers are too tired to care.
Here is my understanding of the situation with the Greek negotiations and the fragility of the current negotiation dynamics. Unlike previous occasions, there may not be any backroom deals to be done as the current Greek government does not seem interested in preserving the status quo.
We have to understand the internal pressures each side face. The Syriza dominated government in Athens has a very narrow majority and risks an internal rupture with its own Leftist elements should it budge from its own red lines of pension and wage cutbacks. This Project Syndicate essay by Greek finance minister Yanis Varoufakis argues eloquently that forcing austerity budgets on Greece in order for its government to run high levels of fiscal account surpluses is counter-productive to its growth outlook and therefore debt repayment sustainability.
From the EU viewpoint, those pleas are falling on deaf ears. The EU cannot be seen to bend against its own stated austerity doctrines, as it would threaten to topple governments in other peripheral countries. Already, anti-austerity elements are gaining power in Spain and Portugal. As well, there are local elections in Italy this weekend, which will be a key test of the Grillo anti-Europe 5-Star Movement. With much of Greece firewalled from the worst of the tail-risk of financial contagion, a Cyprus-style Greek default within the euro may be preferable outcome instead.
What would happen if Greece were to default? In the past few years, much of Greek debt has been restructured. Instead of owing money to the banks, most of Greek debt is now owed to the "institutions", the IMF and other EU countries through an alphabet soup of programs. Benn Steill outlined the level of eurozone government exposure to Greece: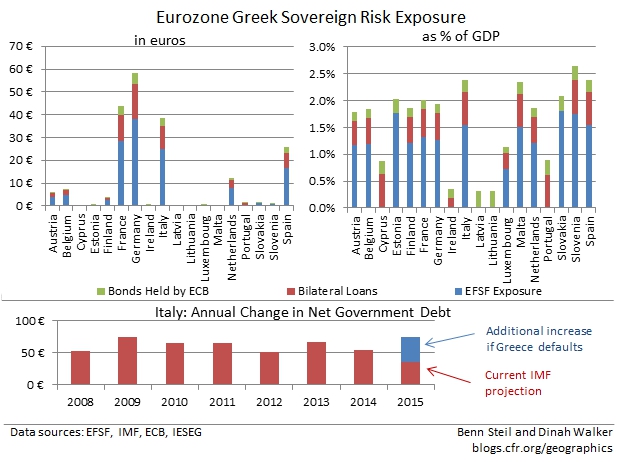
Italy stood out like a sore thumb:
The most worrying case among the creditors, though, is heavily indebted Italy, which would bear up to €39 billion in losses, or 2.4% of GDP. Italy’s debt dynamics are ugly as is—the FT’s Wolfgang Münchau called them “unsustainable” last September, and not much has improved since then. The IMF expects only 0.5% growth in Italy this year.
As shown in the bottom figure above, Italy’s IMF-projected new net debt for this year would more than double, from €35 billion to €74 billion, on a full Greek default—its highest annual net-debt increase since 2009. With a Greek exit from the Eurozone, Italy will have the currency union’s second highest net debt to GDP ratio, at 114%—just behind Portugal’s 119%.
With the Bank of Italy buying up Italian debt under the ECB’s new quantitative easing program, the markets may decide to accept this with equanimity. Yet assuming that a Greek default is accompanied by Grexit, this can’t be taken for granted. Risk-shifting only works as long as the shiftees have the ability and willingness to bear it, and a Greek default will, around the Eurozone, undermine both.
Should Athens default, it would put enormous strain on the Italian budget as it and other eurozone countries were counting on those funds to maintain some semblance of fiscal balance. While a Greek default would not have the kinds of catastrophic consequences it might have had in 2010 or 2011, the outcome would still be negative. Peripheral yield spreads would start to blow out and we could see a risk-off stampede in an illiquid market (see the concerns expressed above in the ECB Financial Stability Review).
In the meantime, the Greek banking system continues to bleed euros. The ECB can put the squeeze on Athens at any time should negotiations falter and the Greek banking system would implode.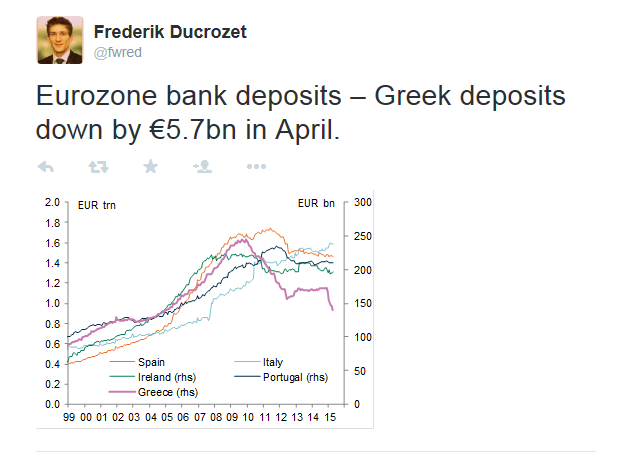
A payment of about €300 million is due to the IMF on June 5. The latest news reports indicate that Athens will make that payment, but no deal is in sight. If Athens were to overcome the June 5 IMF payment hurdle, there is another €348 million due the IMF on June 12, followed by €581 million on June 16 (see calendar from Bloomberg). As well, there are substantial pension and civil service salary obligations due during the same period.
In the meantime, we may have to endure this cycle of stories out of the Greeks that a deal is imminent, but denials out of the EU-IMF camp that much more work needs to be done, much like how Zeus punished Prometheus for giving fire to humans by chaining him to a rock and having an eagle rip out his liver on a daily basis. How much of more this liver-ripping can the markets take?
If an agreement cannot be reached, a Greek default could certainly be the catalyst for a significant risk-off market decline, especially if the contagion effects spread to other countries like Italy.
China: In search of a casus belli?
I hate to mention China as this puts me in the camp of the tinfoil hat brigade. While I am concerned about the volatility in the Shanghai stock market and the risks of a disorderly sell-off. There is about USD 1 trillion of Chinese debt sloshing around in the offshore USD market and no one really knows how inter-connected the global financial system is and what the effects of one or more major Chinese corporate defaults might be. That's not where the major tail-risk from China is coming from.
I am more concerned about the possible effects of a military confrontation in the South China Sea. Despite the speculative element of this story, which probably belongs over at Zero Hedge rather than here, one of the ways investors make money is to watch for stories on page 14 that migrate to page 1. While this story may stay on page 14 and die, it has the possibility of moving up to page 1 too.
In the past few weeks, I have been seeing more and more stories about how China has built seven artificial islands in Spratly Islands, located in the South China Sea. These moves were presumably intended to bolster Chinese claims to the area. While friction occurs in international relations all the time and could be resolved by quiet diplomacy, the US and her allies appeared to have deliberately chosen a course of action designed to provoke and confront China.
- The WSJ reported that Chinese artillery had been spotted on the new islands. Though the artillery poses no threat to the US, they have now disappeared. Why trumpet a story about artillery that may or may not be there?
- Why invite the press to a Navy patrol plane flying over the area, where they were certain to be challenged by the Chinese?
- Why did Japan's Nikkei Asian Review feature a story about President Xi being leery of a coup and assassination? Was it a deliberate attempt to portray the Chinese leadership as being weak? If so, who planted the story?
- China recently unveiled its white paper on military strategy. It was then spun in a hostile and provocative manner: If U.S. Interferes In China’s Land Grab, "War Is Inevitable"--The Global Times.
The American justification for the sudden focus on the South China Sea is the right of freedom of navigation, which is critical to global trade. Peter Lee, writing in Asia Times, debunked that excuse:
There are alternate routes to Japan, Korea, and the Philippines via the Lombok and Sunda Straits in the Indonesian archipelago, and up through the Celebes and Sulu Sea.
Don’t take my word for it. Ask Japan, which has obsessively investigated “energy security” since the OPEC oil shock of the 1970s and has gamed the economics of non-Malacca/non-SCS routes to a fare-thee-well. Bottom line: to avoid Malacca/SCS completely by switching to the Lombok route, shipping costs to Japan go up maybe 13.5% over the Malacca route. In other words, less than half a penny a barrel (see page 65).
Back of the envelope, increase in Japan’s oil import bill of maybe $150 million. Maybe $200 million?
For comparison, value of Japan’s crude oil imports from GCC in 2014: $100 billion. Japan’s 2014 defense budget: $42 billion.
Incremental cost of securing Japan’s energy imports from the PRC threat in the South China Sea: A rounding error.
Pretty much same order of magnitude for South Korea.
Added costs for Philippines to access its ports at Manila, Subic Bay, the Batangas terminal: Basically zip. The Lombok route run right through the Philippine archipelago.
As for Vietnam, it’s a net oil exporter. In any case, its vital ports lie outside the dreaded “cow tongue” and are accessible without traversing the South China Sea.
The media frenzy is somewhat reminiscent of the search for a casus belli, or a justification for war, in the period leading up to the invasion of Iraq. This NY Post piece by AEI scholar Michael Auslin is a typical example of publicly beating the war drums. (If the US doesn't react to China in a muscular way, then America is weak.)
Something odd is going on here as the campaign makes no economic sense. Is the Obama Administration trying to make some sort of foreign policy statement by focusing on the Asia-Pacific using a military lens? (If you didn't believe US government statements on Obamacare, should you believe its statements on the South China Sea?)
If the US, along with her allies, is staging a deliberate campaign of provoking China, then we may be building up to some sort of military confrontation in the summer. In that case, watch regional trade crater and the "Greater China" stock markets (Hong Kong, Taiwan, South Korea and Australia), which have been holding up relatively well, go into free-fall.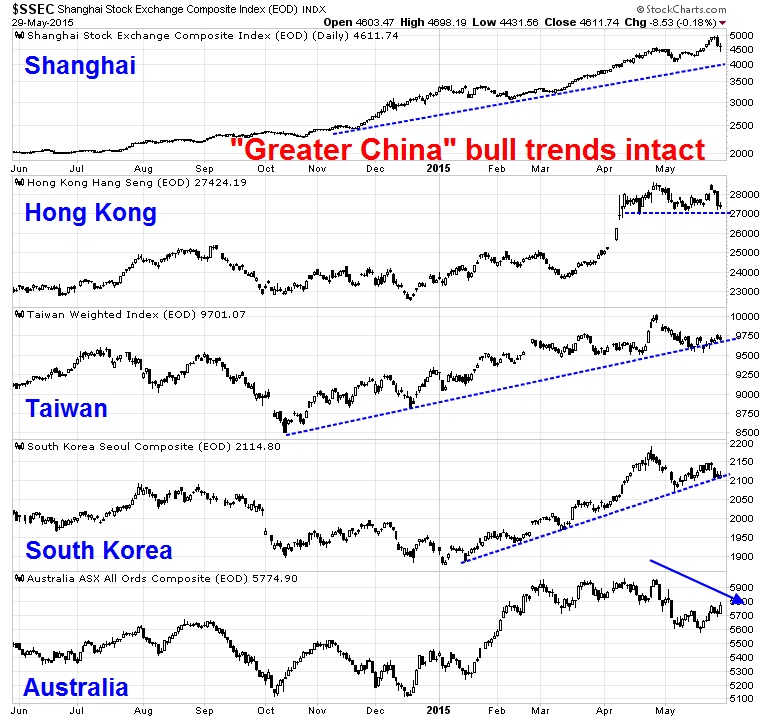
I don`t want to sound like some paranoid maniac writing for Zero Hedge, but Spratly related tail-risk is rising. If the shooting starts, then we would definitely be in a situation where the price of risky assets crater. World trade would collapse and you will hesitate about buying stocks, even though they have gone down 10-20%.
My base case scenario
In summary, with technical conditions deteriorating, US equities are ripe for a pullback. There are three possible scenarios:
- A minor 5-10% hiccup;
- A 10-20% pullback
- A major bear market
I would discount scenario 1 as the kinds of intermediate term indicators I mention tend to be predictive of higher magnitude market weakness. I would rule out scenario 3 as there doesn`t seem to be a recession on the horizon, which is the catalyst for a major bear market. That leaves scenario 2, a 10-20% pullback, by default.
My most likely scenario is therefore a 10-20% decline, much like the experience of 2010 and 2011, both of which saw the market fall 15-20%. My M2 analysis last week indicated a rough downside potential of about 18%, which sounds about right under the circumstances.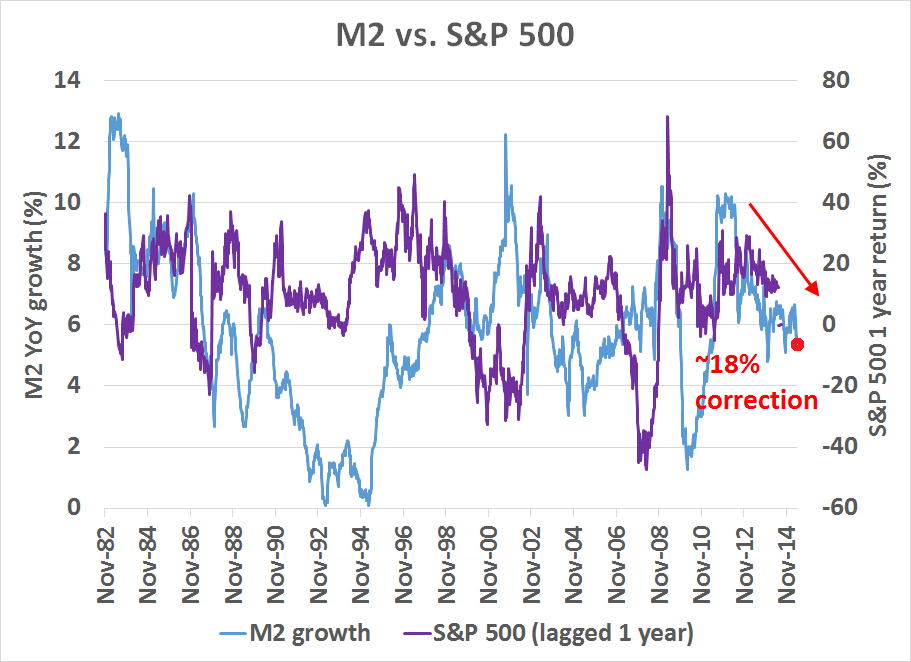
The week ahead
As for the week ahead, a minor decline appears to have begun, just as Springheel Jack predicted. Despite all of the bearish intermediate term indicators, which are not good at forecasting daily squiggles in stock prices, I am not fully convinced that we have seen the start of a major decline yet. If the market were to behave has it has so far in 2015, short-term momentum indicators suggest that it is nearing a point at which it is likely to bounce.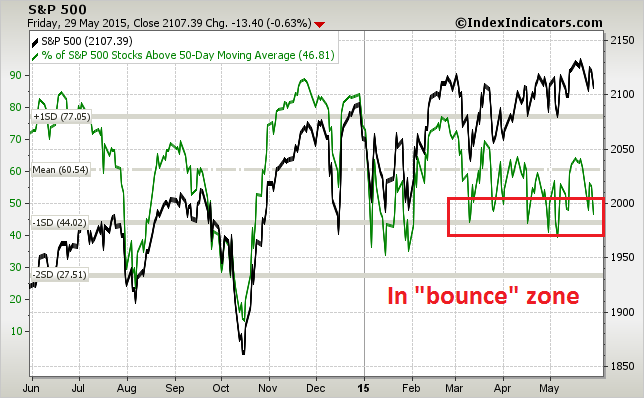
Here are my bearish tripwires for a major downleg in US equities. First, we need to see some conviction and follow-through in market moves. As the chart below shows, RSI(14) momentum remains range-bound and hasn`t shown either an overbought or oversold reading in weeks.
A major fall in stock prices would involve a series of "bad" oversold readings where the markets get oversold and stay oversold. In addition, the % of SPX stocks showing bullish formations on point and figure charts should be cratering, which hasn`t happened so far.
At the very least, I would watch for the violation of the uptrend line at about 2085 (in purple). The next test is a violation of the first support level, which is roughly 2070, and a test and violation of the second major support at about 2040 before declaring that a major correction has begun.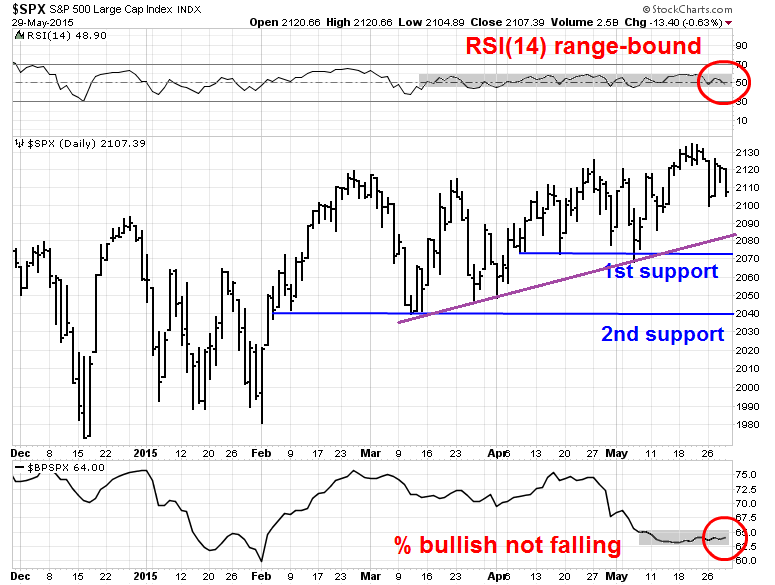
In the meantime, my inner investor remains cautious but not overly panicked. There is no recession in sight and therefore no major bear market around the corner. We are only likely to see a summer squall, not the onset of winter. A wise investment advisor I know put it this way:
A cold day in summer means we have to wear a sweater and long pants, not shovel snow like we would in winter. In contrast, a warm day in winter doesn’t mean we go for a swim and get a sunburn. Seasons change the parameters for the weather.
My inner trader remains bearishly positioned. The first trading day of the month tends to have a bullish bias and he will be watching and he will be watching market internals carefully for signs of whether this is just a pullback within a range, or the start of a major decline,
Disclosure: Long SPXU, SQQQ
Cam Hui is a portfolio manager at Qwest Investment Fund Management Ltd. ("Qwest"). This article is prepared by Mr. Hui as an outside business activity. As such, Qwest does not review or approve materials presented herein. The opinions and any recommendations expressed in this blog are those of the author and do not reflect the opinions or recommendations of Qwest.
None of the information or opinions expressed in this blog constitutes a solicitation for the purchase or sale of any security or other instrument. Nothing in this article constitutes investment advice and any recommendations that may be contained herein have not been based upon a consideration of the investment objectives, financial situation or particular needs of any specific recipient. Any purchase or sale activity in any securities or other instrument should be based upon your own analysis and conclusions. Past performance is not indicative of future results. Either Qwest or Mr. Hui may hold or control long or short positions in the securities or instruments mentioned.
