Trend Model signal summary
Trend Model signal: Neutral
Trading model: Bearish
The Trend Model is an asset allocation model which applies trend following principles based on the inputs of global stock and commodity price. In essence, it seeks to answer the question, "Is the trend in the global economy expansion (bullish) or contraction (bearish)?"
My inner trader uses the trading model component of the Trend Model seeks to answer the question, "Is the trend getting better (bullish) or worse (bearish)?" The history of actual (not backtested) signals of the trading model are shown by the arrows in the chart below. In addition, I have a trading account which uses the signals of the Trend Model. The last report card of that account can be found here.
Update schedule: I generally update Trend Model readings on weekends and tweet any changes during the week at @humblestudent.
Technical: Negative divergences galore
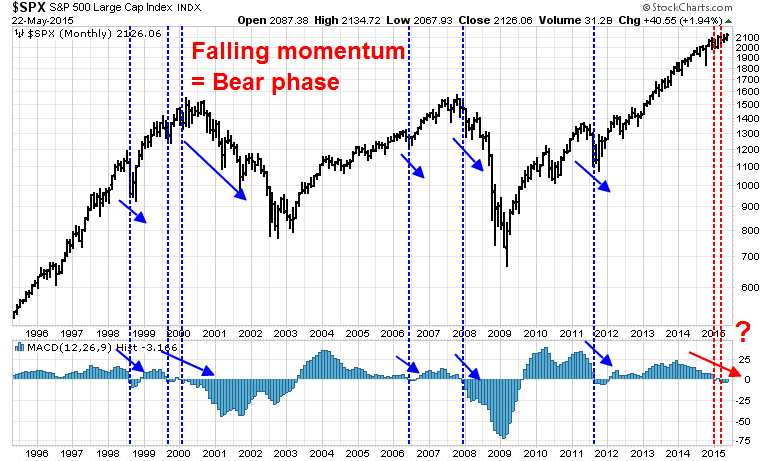
I recently wrote a post outlining the reasons why I believe that the next major move in the US equity market is down and I drew my lines in the sand for turning bullish (see Why I am bearish (and what would change my mind)). To summarize, the main reasons for my bearish outlook are the combination of an extended uptrend and flagging price momentum. These conditions can be shown in a number of ways, but the best graphical example is the deterioration in MACD histogram from positive to negative. Past episodes have always resolved themselves bearishly in the last 20 years.
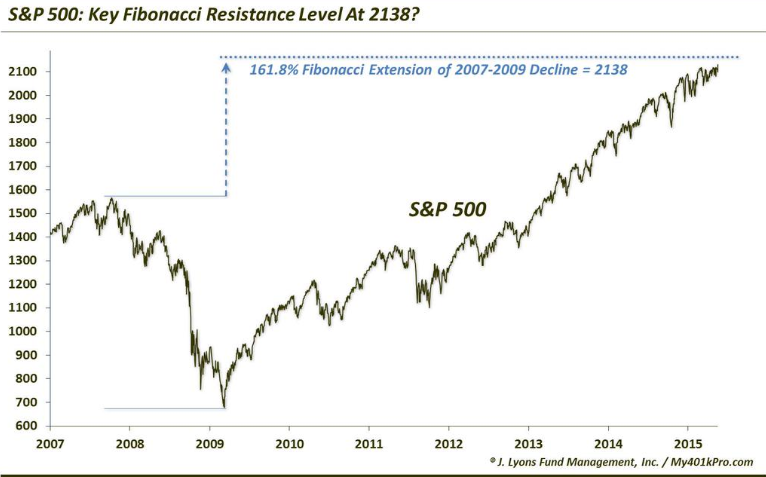
In addition, a number of chartists have pointed out that the SPX is now testing a key 161.8% Fibonacci extension from the 2009 bottom. The 2138 level represents an important resistance level (via Dana Lyons):
Since I wrote that post indicating my bearish concerns, negative technical divergences continue to pile up (see What apples-to-apples market breadth is telling us).
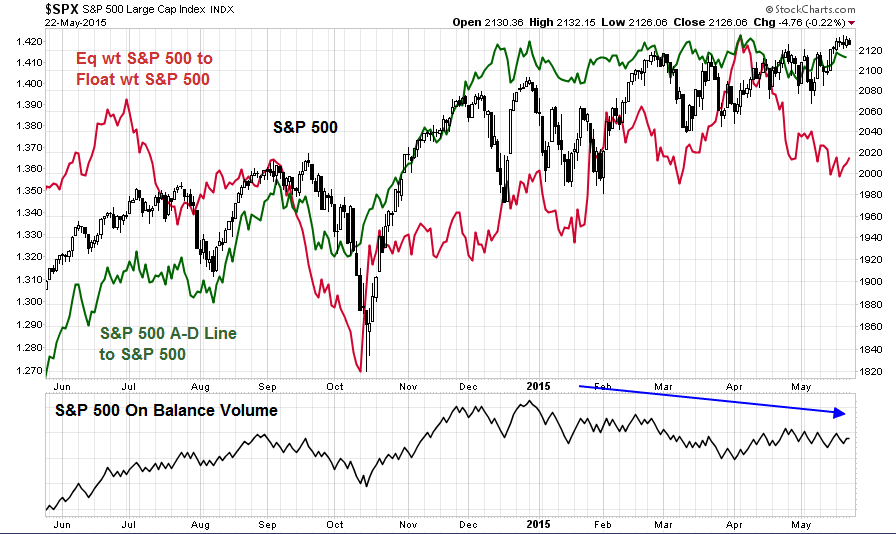
Last week, Brett Steenbarger also highlighted the kinds of technical deterioration and negative fund flow divergences he was seeing:
As you can see from the charts above, we've recently made fresh highs in SPY. During that period, we've seen below average buying pressure (the zero level is average) and more than average selling pressure (values below zero show heavier selling). That suggests that more stocks have been trading on downticks than upticks, even as the broad market average has risen to new highs. This is the first divergence we've seen in the cumulative NYSE TICK in many months.
This excess of supply pressures over demand helps account for the weak breadth of the recent rally. Interestingly, yesterday we hovered at new highs in the index, but only 500 stocks across all exchanges traded at fresh one-month highs, while 389 touched fresh one-month lows. Volume in SPY has also been unusually low during the past several sessions. Since 2013, when SPY volume has been in its lowest quartile, the next ten days in SPY have averaged a loss of -.08%. When volume has been in its highest quartile, the next ten days in SPY have averaged a gain of 1.41%.
A break to new highs on expanded volume and breadth would clearly violate the pattern of weakness noted above. Until that point, I don't see an edge in chasing the upside.
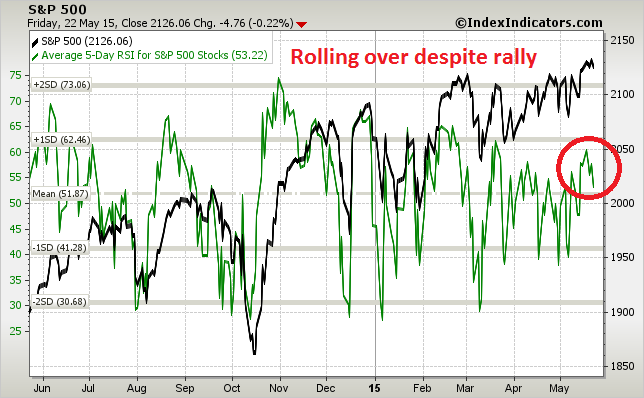
As an example, momentum indicators such the net 20-day highs vs. lows have been rolling over despite the fresh intra-day highs achieved last week (via IndexIndicators):
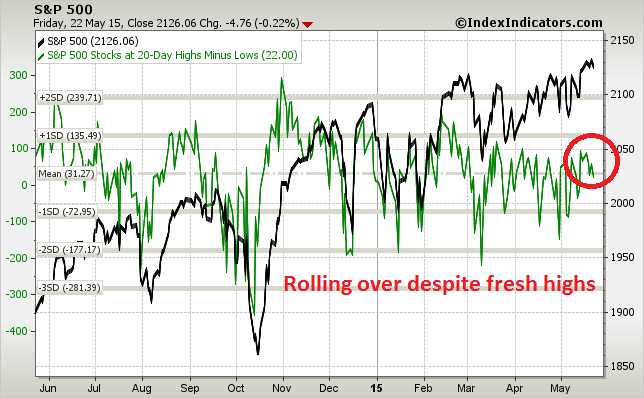
Similarly, average RSI(5) of SPX stocks has been falling, indicating a negative momentum divergence.
I could go on, but this looks like a very tired bull.
Macro outlook mixed
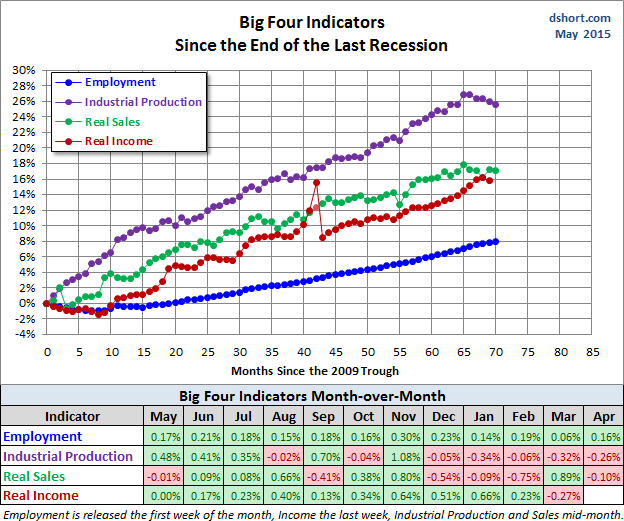
At the same time, we have a mixed macro outlook. While there were bright spots, such as the better than expected housing permits and housing starts, the latest update of Doug Short`s Big Four Recession Indicators continues to show very weak readings. The April Big Four average is on the verge of going negative, which would be the second time in three months (emphasis added).
The overall picture of the US economy had been one of slow recovery from the Great Recession. We had a conspicuous downturn during the winter of 2013-2014 and subsequent rebound. And weak Retail Sales and Industrial Production in recent months triggered a replay of the "severe winter" meme. However, we're now getting data points for Spring months, not the Winter, and as yet we're not seeing a rebound. Industrial Production has decline for five consecutive months and Real Retail Sales have contracted for four of the past five months.
At this point, the average of these indicators in recent months suggests that the economy remains near stall speed, and the risk of a downturn appears to have increased.
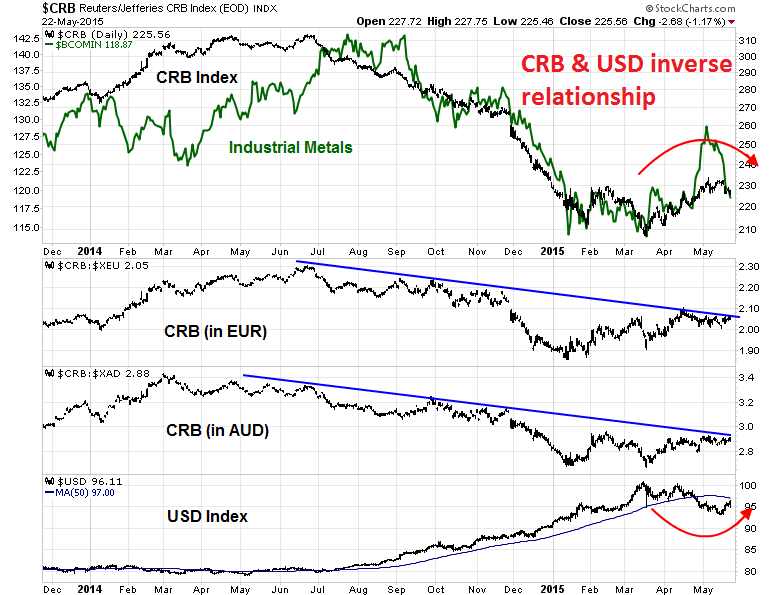
We saw further disappointment globally last week as the HSBC-Markit Manufacturing PMIs missed expectations in the US, Europe and China. Commodity prices, which are sensitive barometers of global growth and a key component of the Trend Model, are still showing a bearish trend. While USD strength last week no doubt created headwinds for commodity prices, the chart below of the CRB Index priced in euros and Australian dollars shows that commodity prices remain in a long-term downtrend.
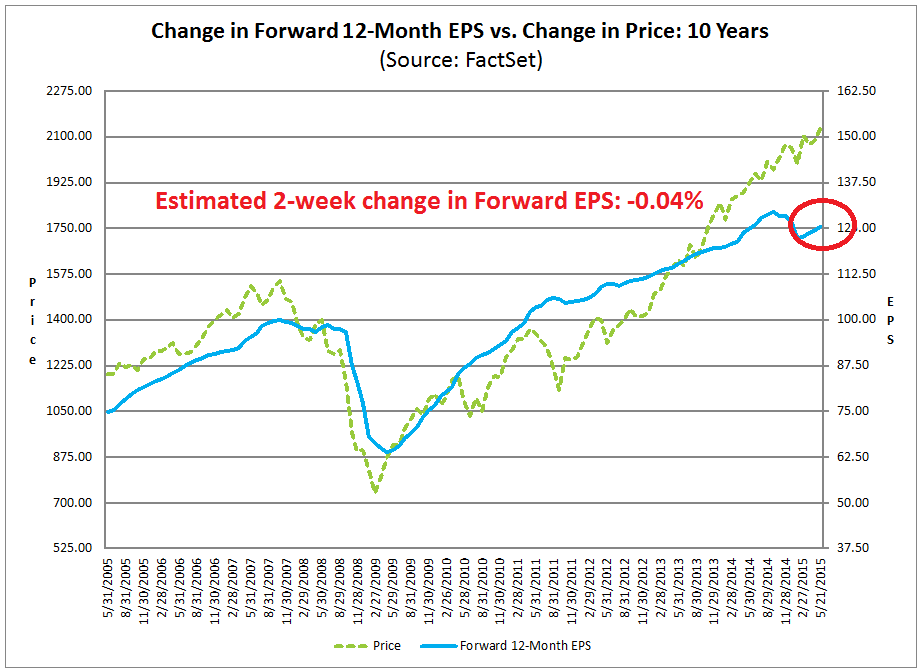
For equities, the earnings outlook is a key driver of stock prices. I was surprised to see the latest update from John Butters of Factset indicating that upward momentum in forward EPS has stalled after a few weeks of rebound. My own estimate of the two week change (there was no Factset update for one week) in forward EPS for the SP 500 was -0.04%. The decline was attributable to a fall in FY2016 EPS from 134.36 to 134.25.
Think 2010 or 2011, instead of major bear
Despite these negatives, I am not forecasting a major bear market to start from current levels. Bear markets are usually triggered recessions. Despite the stall warnings from Doug Short`s Big Four Recession Indicators, I agree with New Deal democrat's assessment of a shallow industrial recession, but no full recession as employment and the American consumer remains healthy:
The US economy remains in a shallow industrial recession, but the remainder of the economy, as shown by housing permits and initial jobless claims remains quite positive. This has been driven by a 16% appreciation of the US$ globally, and secondarily by the effects of the collapse of commodity prices on raw materials producers. I expect the US$ to continue to retreat due to coincident weak economic performance, and the underlying past positivity of the US long leading indicators will come through.
In a previous post, he wrote that while industrial production was weakening, we are not seeing the classic signs of recession from employment and housing, which remain strong.
Yesterday's report that housing permits and housing starts both reached post-recession record highs in April was the most important data of the year to date.
Quite simply, it takes the possibility of recession off the table for the rest of this year. I expect employment and income to continue to grow, and real retail sales to make overcome the weakness they have exhibited since last November, and make new highs. This also suggests positive news as to wages in the coming months.
Instead of a full-blown recession, it looks like we just get a mid-cycle growth scare. The combination of a growth scare and a Federal Reserve that is determined to start raising rates this year, which Janet Yellen made abundantly clear in her latest speech, is likely to spark a corrective episode in the stock market. Now throw into the mix a possible wildcard such as a Greek default (that is looking more and more likely as the IMF and EU may be at odds with each other and the Greek interior minister stated that the IMF will not be paid in June), you have the ingredients of a market downturn much like what we saw in 2010 and 2011.
Notwithstanding the recent Fedspeak (see The Fed`s Magical Mystery Tour), the Fed is already well on its way to normalizing monetary policy. The chart below shows the relationship between YoY change in M2 money supply and YoY change in the S&P 500, lagged 1-year. M2 growth has been showing a decelerating pattern for some time. While the relationship is by no means perfect, it currently implies a YoY S&P 500 decline of 7-8%. Since the SPX was about 1911 a year ago, that would imply a market downturn of about 18%, which is consistent with the 15-20% hiccups seen in 2010 and 2011.
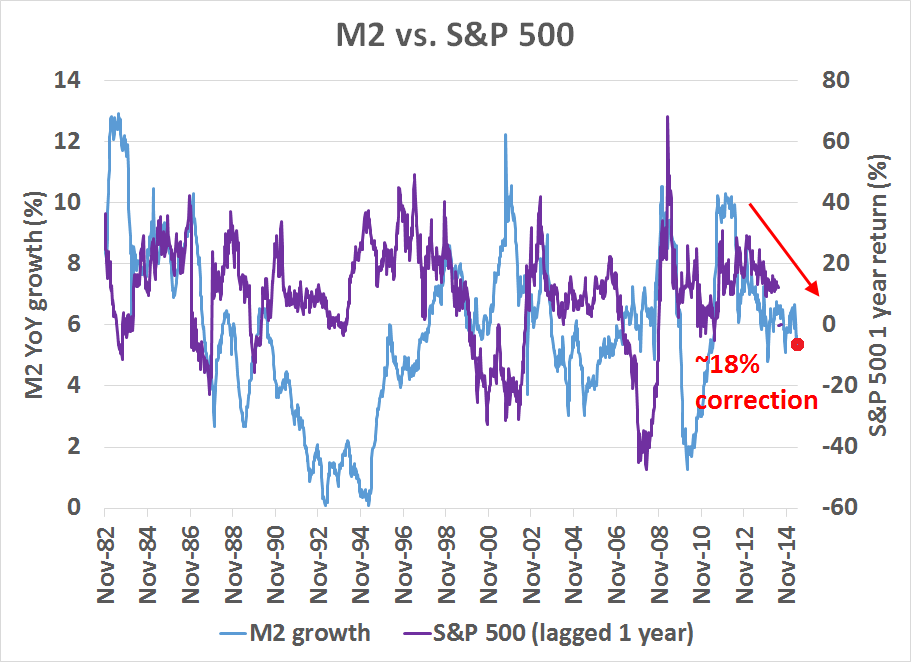
My base case scenario is therefore a rough downside SPX target of 1750 on this possible market downdraft.
The week ahead
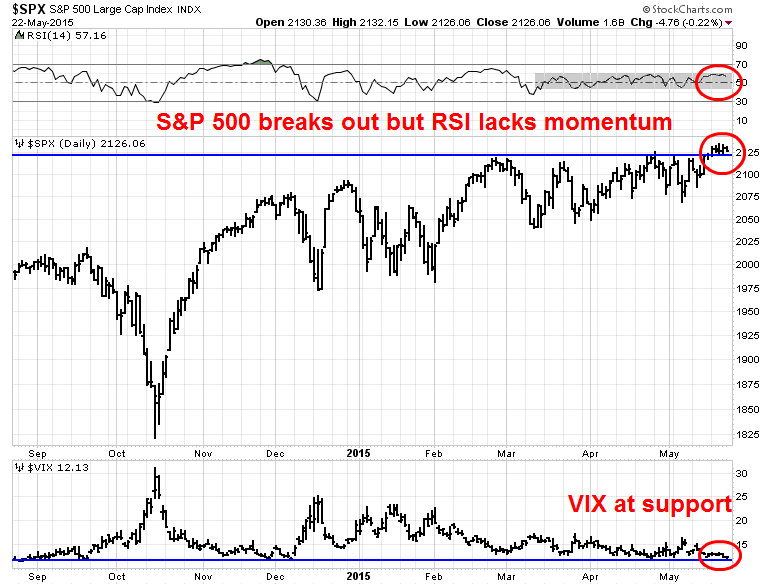
The week ahead is a holiday shortened week. In the last few weeks, the SPX has continued to show a pattern of indecisive price momentum as it refused to get overbought on advances and oversold on declines. In the meantime, the market is likely capped by the Fibonacci resistance of 2136, which was mentioned earlier, a mildly overbought condition and the VIX Index, which is inversely correlated to stock prices, resting on key support.
For an even more tactical view of the market, I defer to Springheel Jack, who found a series of bearish reversal formations with the use of Japanese candlestick charting techniques in the SPX just as the market reached fresh intra-day highs last week:
We have seen two consecutive bearish reversal candles in the last two days. A bearish reversal candle is one where a new high is made and then the day closes red. These candles are common enough, and if you look through the SPX chart you will see many of these both at tops and smaller reversals. Series of this type of candle are rare however.
In a subsequent post written on Friday, he found that such patterns have a high probability of resolving themselves bearishly (emphasis added):
I've been doing more work on the series of bearish reversal candles over the last twenty years and have combed through 90% or so of the intervening period. I'll finish that at the weekend and may do a dedicated post on these. The ones I have found so far are:1999 Feb - From 2nd candle into 5% declineNow the first thing that really springs to the eye here is that the only two of these series of two bearish reversal candles made a new high short term, and one of those was the September 2014 series of three. 8 of the 9 resolved down effectively immediately. If we should beat Wednesday's high at 2134.72 before a decline to at minimum a test of 2099.5 then this time would be a rarity, and that could happen, but the odds are against it, and if seen that would most likely be because of tiny holiday volume. . I would note that the SPX high yesterday was 0.44 handles under Wednesday's new all time high. This setup is highly bearish short term and the median decline from it has been in the 4/5% area.
2002 Dec - From 2nd candle into 17.3% decline
2004 Dec - From 2nd candle into 4.46% decline, then marginal higher high, then 7.56% decline
2005 Oct - From 2nd candle into 2.08% decline
2005 Nov - Failed and resumed uptrend into December interim high
2005 Dec - From 2nd candle into 4.44% decline
2007 Oct - From 3rd candle into 57.4% decline
2014 May - From 2nd candle into 1.66% decline
2014 Sept - From 2nd candle into 1.65% decline, then marginal higher high, then 9.83% decline
2015 May - To be determined
(From looking at his data, I think he means a median decline of 4-5% in the last sentence.)
My inner investor is cautious and his asset allocation is neutrally weighted at levels determined by his long-term investment policy. My inner trader remains short the market.
Disclosure: Long SPXU, SQQQ
Cam Hui is a portfolio manager at Qwest Investment Fund Management Ltd. ("Qwest"). This article is prepared by Mr. Hui as an outside business activity. As such, Qwest does not review or approve materials presented herein. The opinions and any recommendations expressed in this blog are those of the author and do not reflect the opinions or recommendations of Qwest.
None of the information or opinions expressed in this blog constitutes a solicitation for the purchase or sale of any security or other instrument. Nothing in this article constitutes investment advice and any recommendations that may be contained herein have not been based upon a consideration of the investment objectives, financial situation or particular needs of any specific recipient. Any purchase or sale activity in any securities or other instrument should be based upon your own analysis and conclusions. Past performance is not indicative of future results. Either Qwest or Mr. Hui may hold or control long or short positions in the securities or instruments mentioned.
