Thursday November 23: Five things the markets are talking about
While investors believe the Fed will raise rates in December, many are trying to gauge how aggressively the central bank will tighten monetary policy next-year.
Yesterday’s FOMC minutes showed that most Fed policy makers saw a near-term rate hike as appropriate. Some members were opposed citing weak inflation; with several others noted that a move was hinged on data. Most participants continued to think tighter labor markets would ultimately produce higher inflation
This ‘dovish’ sentiment is leading markets to reduce their expectations for interest rate increases next year. Growing consensus is beginning to expect only two rate increases in 2018, instead of the three hikes implied by the dot plot.
The dollar has steadied after tumbling yesterday in the wake of the more dovish sentiment. This may weigh further on the USD, especially if we start to see a broader correction develop in U.S. rates markets.
Note: The U.S is out for Thanksgiving today, so liquidity is expected to be significantly lower into the weekend.
German politics continues to hog the spotlight, with the Social Democrats ready to talk with Chancellor Merkel and are prepared to offer her limited support for a fourth-term.
1. Stocks see red
The biggest slump in Chinese stocks in almost two-years is taking some of the shine off another record high in the global equity bull-run.
Tighter liquidity enforced by the Chinese government stepping up ‘deleveraging ‘is causing the massive swings in Chinese asset classes.
Note: Japan was closed for a bank holiday.
Overnight in China, consumer and healthcare firms led the fall and dragged the CSI 300 index down sharply by -2.93%, its biggest fall in percentage terms since June 2016. The broader Shanghai Composite Index lost -2.26%, its worst day since December.
In Hong Kong, stocks also ended sharply lower, pressured by the mainland’s soured sentiment. The Hang Seng index fell -1.0%, while the China Enterprises Index lost -1.9%, to its lowest level in a month. Investors took profit in sectors including financials, IT and consumer goods.
In Europe, regional indices are trading off their lows, with most indices in the ‘black’ following strong PMI data in Europe where manufacturing PMI’s registered a near 18-year high in the Eurozone (see below). Trading activity is light as the U.S markets are closed today.
Indices: STOXX 600 -0.2% at 386.5, FTSE -0.3% at 7397, DAX -0.1% at 13004, CAC 40 +0.2% at 5366, IBEX 35 +0.4% at 10058, FTSE MIB +0.3% at 22385, SMI flat at 9293, S&P 500 Futures flat
2. U.S. oil prices ease from highs on oversupply worries, gold lower
U.S. oil prices have eased back from their two-year high, as concerns about oversupply outweighed the impact of a pipeline shutdown in the U.S.
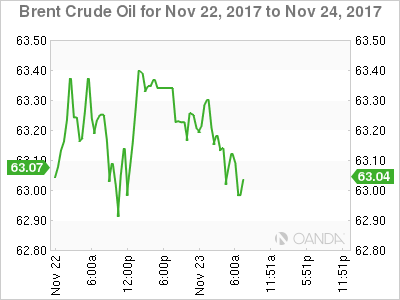
U.S light crude (WTI) is trading down -17c at +$57.85 a barrel, slipping from its highest level since mid-2015 reached yesterday of +$58.15. Brent crude is at +$62.98 per barrel, or down -34c from yesterday’s close.
U.S. crude had been boosted by the shutdown of the +590k bpd Keystone pipeline – it was closed last week due to an oil spill.
EIA data this week shows that U.S output has risen by +15% since mid-2016 to a record +9.66m bpd. The U.S., previously the world’s biggest importer of crude oil, is now one of its biggest exporters, behind Russia and Saudi Arabia.
Note: OPEC meets next week, Nov. 30, to discuss policy, with Saudi Arabia lobbying for an extension to the cuts. However, Russia has sent mixed messages on its position, believing that cuts had hit its economy.
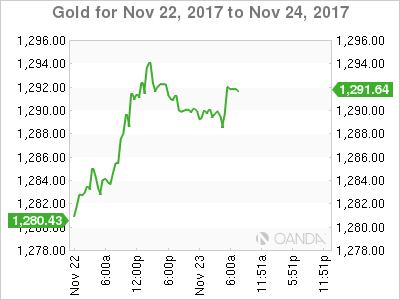
Gold prices are lower overnight, with investors taking profits after gains of nearly +1% in the previous session on weaker U.S data and concerns among some Fed members over lower inflation. Spot gold is down -0.2% at +$1,289.88 per ounce.
2. U.S. yield curve steepens
While a move in December by the Fed to between +1.25% and +1.5% is still almost fully priced in, Fed fund futures are rallying to show rates at just +1.75% by the end of 2018.
The Fed’s dovish turn yesterday has helped break the sell off in short-term U.S. Treasuries, with yields on the two-year note falling almost -5 bps to +1.727% – the sharpest daily drop since early September.
Borrowing costs in the euro area are also creeping higher ahead of the ECB’s October meeting minutes this morning (07:30 am EDT).
Germany’s 10-year Bund yield has climbed less than +1 bps to +0.35%, while in the UK the 10-year Gilt yield has decreased -1 bps to +1.263%, the lowest yield in more than two-weeks.
3. Dollar under pressure
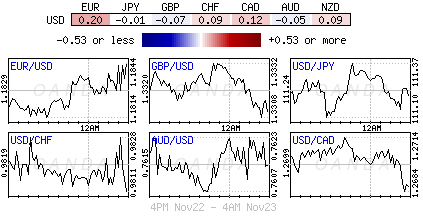
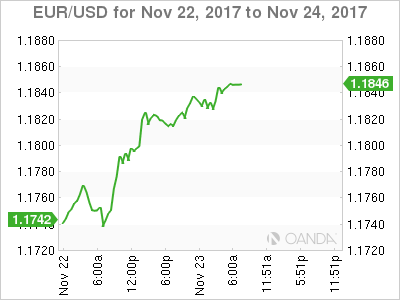
The EUR (€1.1841) and GBP (£1.3303) are trading well versus the USD, but this has been more to do with broader USD weakness in the aftermath of yesterday’s FOMC minutes.
The EUR is further aided by much better manufacturing PMI data for France, Germany and the Eurozone. The data suggests that the regional economy is running on all cylinders. The pair tested a week high trading atop of €1.1850 area. If Germany can develop a ‘grand coalition’, should see the EUR benefit even further.
GBP/USD may see its eight-day winning streak come under pressure as Q3 Preliminary GDP came in-line with expectations (+0.4%) and showing a slowdown taking effect as the Brexit negotiation continue. GBP is a tad lower hovering ahead of support levels just below £1.3300 area.
USD/JPY has posted a new two-month lows to test below ¥111.10 in the overnight session.
Dollar ‘bears’ believe that until there’s considerable progress on U.S. tax reform, the dollar is likely to stay pressured by a stronger EUR and rising Asian currencies.
5. Eurozone data point to strengthening recovery
Data this morning showed that the composite Purchasing Managers Index for the eurozone rose to 57.5 this month from 56.0 in October, reaching its highest level in more than six-years.
The strong print suggests the eurozone economy will grow at a quarter-to-quarter rate of +0.8% in the final three months of the year, which would mark a pickup from +0.6% in the three months through September.
France was the main source of surprise, recording its highest reading since the middle of 2011. That surge was led by its services sector.
Note: France’s economy has been growing over half a percentage point a quarter for a year, fuelled by a strong recovery in business investment and steady consumer spending growth. Still, employment remains a weak spot in France’s economic recovery.
Germany’s stats Thursday also confirmed that its economy grew at a quarter-to-quarter rate of +0.8% in the three months through September, making it the strongest of the G7 developed countries in that period.
