Trend Model signal summary
Trend Model signal: Neutral (downgrade)
Trading model: Bearish (downgrade)
The Trend Model is an asset allocation model used by my inner investor. The trading component of the Trend Model keys on changes in direction in the Trend Model - and it is used by my inner trader. The actual historical (not back-tested) buy and sell signals of the trading component of the Trend Model are shown in the chart below: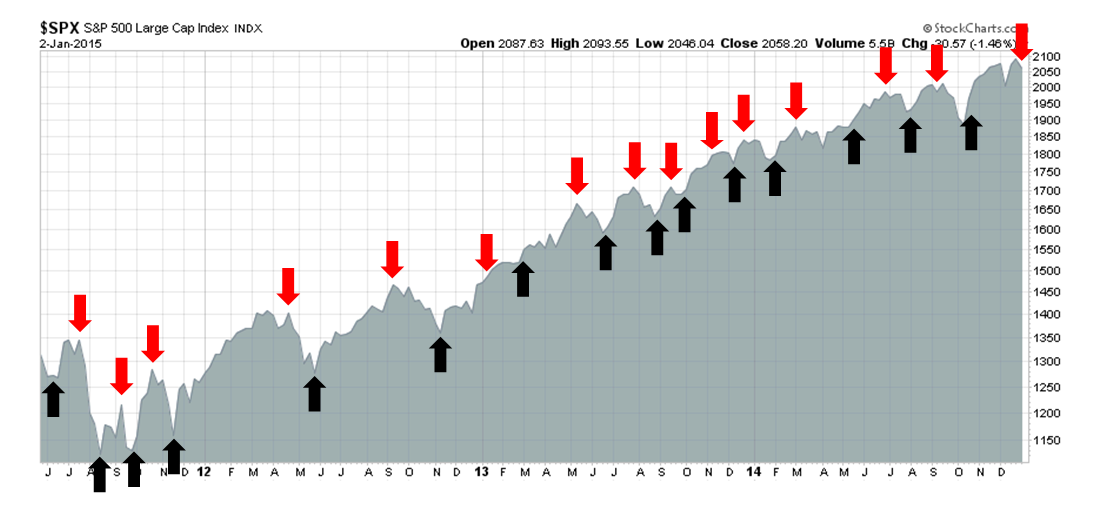
Update schedule: I generally update Trend Model readings on weekends and tweet any changes during the week at @humblestudent. In addition, I have been trading an account based on the signals of the Trend Model. The last report card of that account can be found here.
A global growth scare on the horizon
I have laid out a scenario of late December strength, early 2015 weakness and a possible stock market bottom in late January (see My trading plan for December, What happens after Santa leaves? and A finger poised on the "sell" button). So far, the market has followed that roadmap with a Santa Claus rally and now some early signs of market weakness.
The Trend Model, which analyzes the market's message of global growth, is flashing signs of caution. While the US remains an island of economic strength, weakness is appearing in China and Europe.
China is slowing
China`s economy has been slowing. For more color, please see the collection of Tom Orlik`s seven tweets from Business Insider: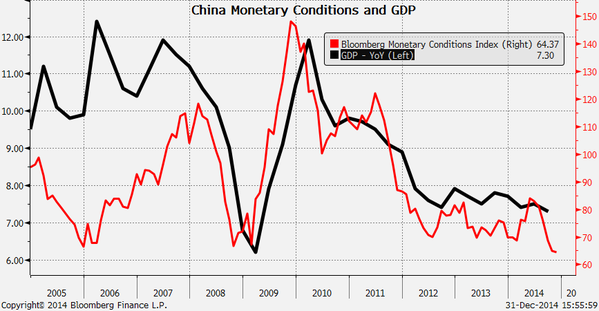
The Shanghai Composite has been on a tear lately, but Orlik demonstrated that the Chinese stock market has little to do with the Chinese economy: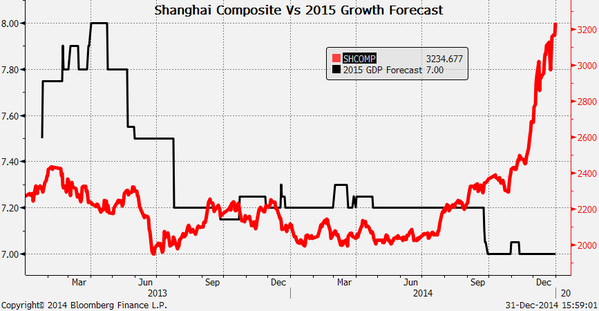
Notwithstanding the strength of Chinese equities, my real-time market based indicators of Chinese activity have been in decline. Commodity based indicators, such as industrial metals, the Continuous Commodity Index (equal weighted CRB) and the AUD/CAD exchange rate, are all in serious downtrends. The stock markets of China`s major Asian trading partners (Hong Kong, Taiwan and South Korea) aren`t acting well either. The HK and Korean markets are in downtrends. The Taiwan market is the strongest of the ones I watch as it broke down through an uptrend. The rally is now testing that uptrend-support now turned resistance.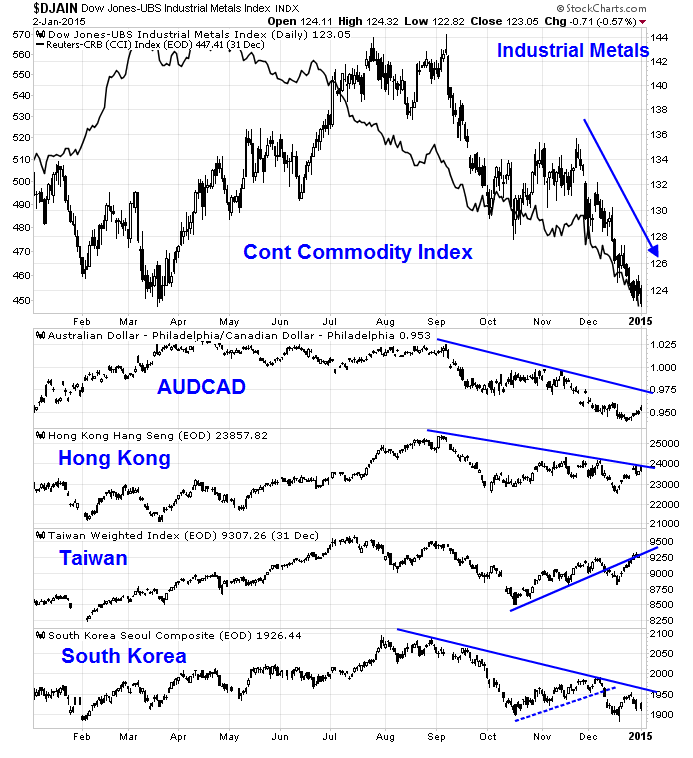
More European theater
The European bourses also show similar signs of market weakness. The London market, as measured by the FTSE 100, is displaying a rounded top pattern. This index is now below both its 50 and 200 day moving average, indicating that a downtrend is on the way.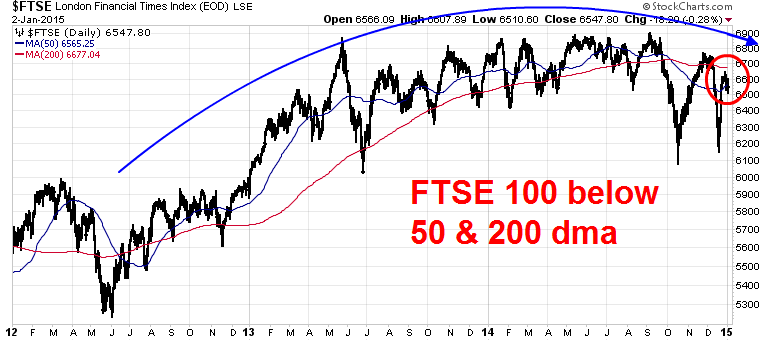
Eurozone stock markets are faring slightly better, but not much. The Euro STOXX 50 is exhibiting a similar topping pattern as the FTSE 100. This index breached its 200 DMA, but it has recovered to above its 50 DMA.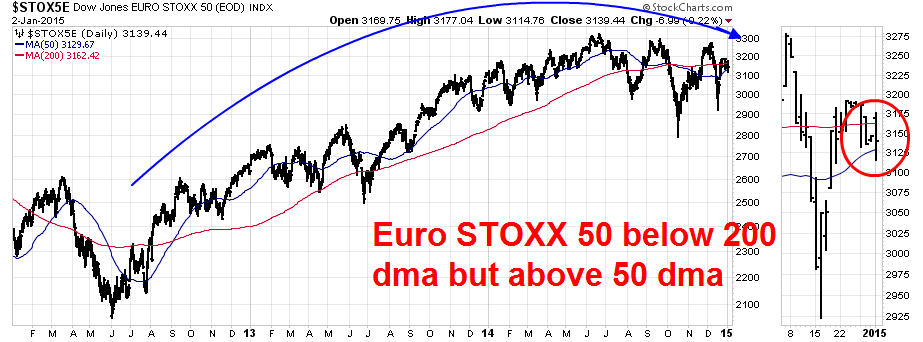
As the eurozone slips into deflation, the market`s hopes have turned to the prospect that the ECB will announce some form of QE program to expand its balance sheet, which is now in contraction. Timing may be a problem, however. The January ECB meeting precedes the pending Greek election, which is seeing the leftist SYRIZA party leading in the polls. (In case you missed it, SYIRZA has vowed to renegotiate the terms of the last Troika bailout agreement.)
Such circumstances are likely to create political problems within the ECB Governing Council over QE, given the uncertainties surrounding the Greek election. Even if Mario Draghi could get the Governing Council to come to a consensus over the launch of QE, any announcement would likely be delayed after the January meeting, pending the results of the Greek election.
Make no mistake, we will get more of the usual public grandstanding, but it will only be theater. Here is Marc Chandler's very sensible analysis of Greece (emphasis added):
In heated negotiations, it is not uncommon for each side to accuse the other of blackmailing the other. Syriza accuses the Troika of blackmailing Greece: Either Greece cuts its nose to spite its face by enacting even more austerity or the ECB cuts off the life support of liquidity. The Troika itself has not accused Greece of blackmailing it but that has not stopped numerous observers from claiming exactly that: Either the Troika renegotiates Greece debt, or the country will default.
What makes Greece's case different from other debtors who have often used attainment of a primary surplus to squeeze extra concessions from the creditors or defaulted, is that its debt is primarily in official not private hands. Of the roughly 320 bln euros of debt, only 54 bln is in private hands. The rest is owned by the EU collectively and individually, the IMF and ECB. It has long understood that when at the end of Greece's aid program, the official creditors would ease the debt burden by lengthening maturities and reducing interest rates. There is more room to negotiate that the media often suggests and that the pundits as partisans want to recognize.
Other parts of Syriza's platform are frankly more difficult for the official creditors to swallow. The budget agreements cannot be annulled. Unwinding some of the austerity measures in terms of civil servant salaries and pensions will destroy the very conditions that allow Greece to negotiate, if not from a position of strength, then a stronger position nonetheless. There may be room for some additional government spending, but it will not be acceptable to return to the pre-2009 period.
The markets will get spooked, especially if SYRIZA wins the election. But don`t over-react, it`s only more of the usual European theater.
Growth risks not discounted
Globally, the US appears to be an island of stability. New Deal Democrat summarized the global macro situation well in his weekly macro review:
As 2014 ends, the story remains one of continuing global weakness, but continuing positives in the US economy. In general the signs for the US economy for 2015 remain good, although the just-barely-positive advance of housing this year stands out as a contrary caution.
However, the US equity rally of the past couple of weeks does not seem to have discounted the deflationary tide washing around the world. As the major market participants go back to on Monday, the Trend Model is telling me that US stocks are likely to see weakness from slowing growth.
In a Barron`s interview, Jeff Gundlach expressed similar reservations about the equity market:
There’s plenty wrong globally that will eventually weigh on the stock market. He mentions the obvious. Emerging-market economies are sharply slowing. China, despite its current stock market boomlet, rests on shaky financial and economic foundations. Greece threatens to come apart again. Russia is a basket case. Sinking oil prices threaten to amp up geopolitical risks that Russia or Iran might do something dangerous out of economic desperation. Currency wars impend, led by Japan’s systematic yen-devaluation campaign.
Gundlach pointed to several charts to support his views, such as the chart of declining commodity prices, as signs of slowing global growth. However, I believe that commodity prices are predominantly driven by Chinese demand and therefore a better China growth indicator than a global growth indicator. Nevertheless, the point is well taken (emphasis added):
One shows U.S. CRB Index Futures -- weighted commodity prices going back five years. To the untrained eye, there’s not much to see beyond a vertiginous peak made between late 2009 and late 2010 with a series of smaller peaks saw-toothing down to present levels. But Gundlach draws another conclusion: “Look, commodity prices have fallen back to their lows of 2009, which of course was at the height of the financial crisis. Something is obviously very wrong these days in the global economy.”
He also shares my concerns about Europe:
Another chart, delineating the movement in yields of two-year government securities of various key euro-zone nations over the past 14 months, looks like a tangle of spaghetti. But Gundlach points to an interesting divergence that has shown up since September, when the rate on German debt sharply diverged from two-year rates on Italian and Spanish debt. The German yield turned negative, while the two Club Med countries’ yields headed the other way. This told Gundlach that trouble lies ahead for the euro zone beyond the headlines of European political unrest. “Folks in Europe are obviously losing confidence and scared if they are willing to pay Germany for the privilege of parking their funds there,” he says.
Weakness early, then a fast recovery
After the euphoria of the Santa Claus rally, the US equity market may be starting to react to these instances of rising deflationary fears. However, I have noticed that the moves have tended to sharp and brief.
I noticed that some of my short-term indicators were nearing oversold readings at the height of Friday`s decline. In the space of only three days, the VIX term structure was nearing inversion; TRIN was approaching 2.0, an oversold reading; and the VIX Index was just a touch under the 20 level, which has marked oversold levels.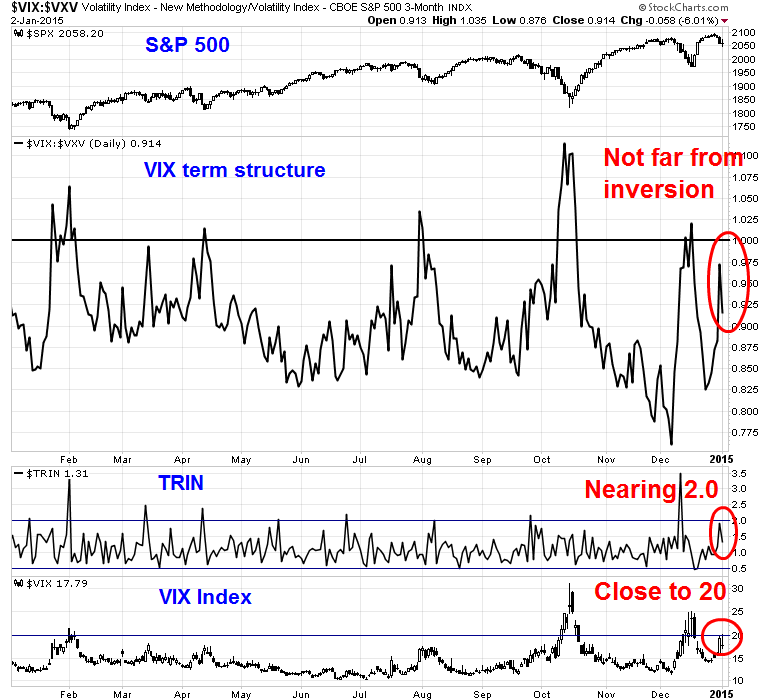
The current downdraft—should it continue—may be similar to the air pocket that the stock market experienced in early December - short and sharp. I will, of course, have to watch how market indicators develop, but the magnitude of last week`s moves caught me by surprise as I had expected the decline would develop over the next few weeks.
Instead, it may be over in one or two weeks. In addition to the short-term indicators outlined in the chart above, I`ll also be watching for a spike in the new 52-week lows. Past bottoms have been marked by sharp rises in this indicator, which hasn`t happened yet.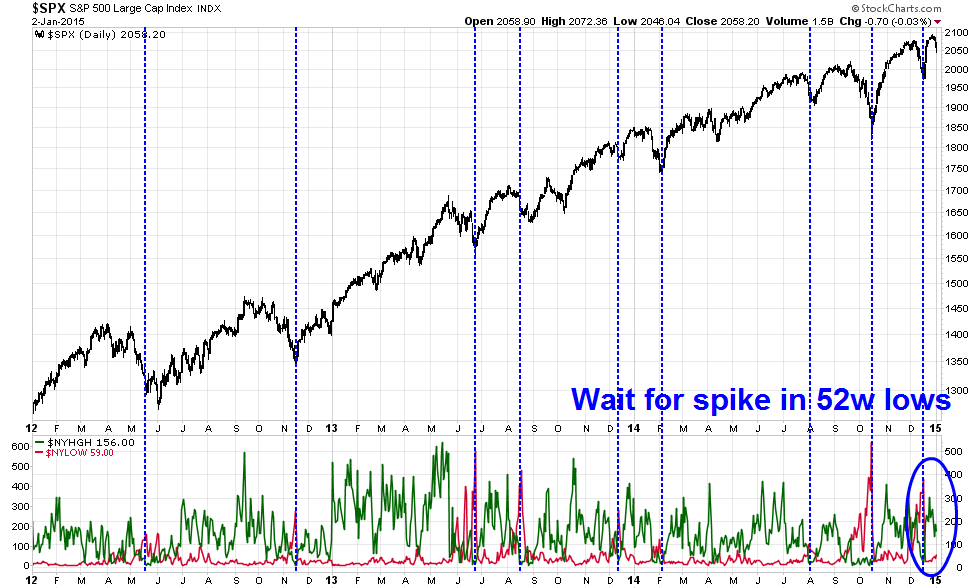
Watch Earnings Season
I reiterate my belief that we are not seeing an intermediate term market top. As this Ed Yardeni analysis shows, SPX forward 12 month EPS are falling. Such episodes have been associated with stock market weakness in the past (annotations in purple are mine).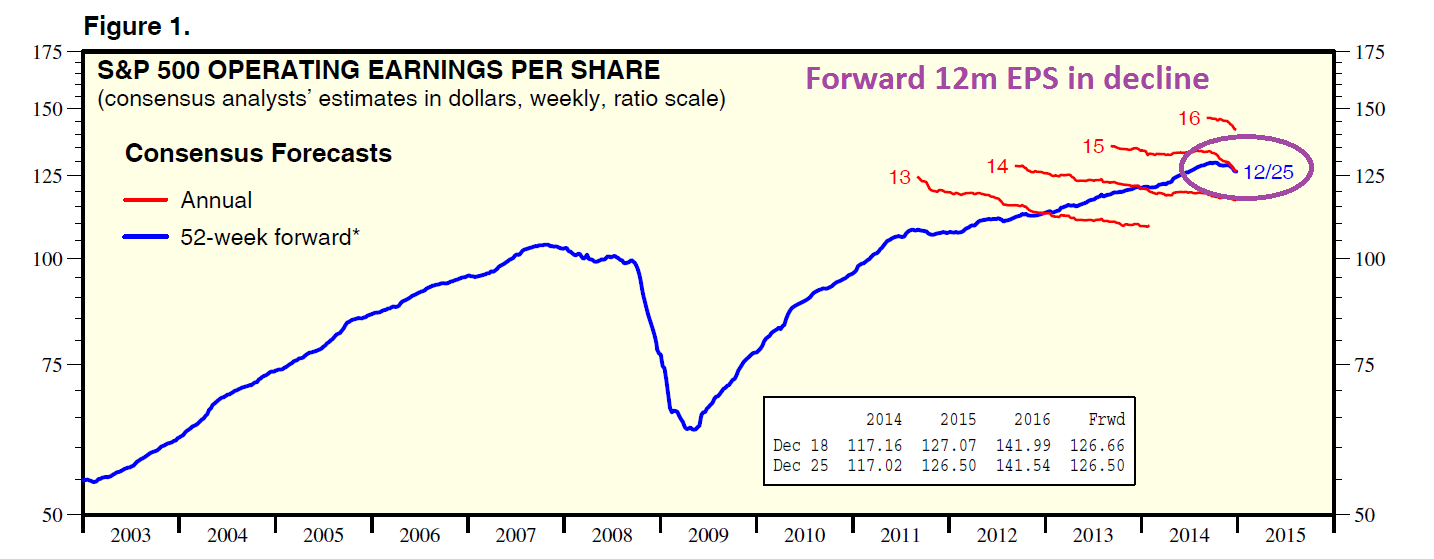
However, I expect that forward 12-month EPS to start rising soon. As Earning Season progresses, the benefits of falling oil prices will become more clear and more quantifiable. When it becomes evident that lower energy prices are showing up in lower input costs and higher consumer spending, earnings estimates will rise again and spark an equity rally.
The timing of such a recovery will depend on how quickly the analyst community reacts to earnings reports. Watch for the market psychology to change in late January or early February.
A tradeable downdraft, or just a blip?
In the meantime, my inner trader went from a long position to cash on Monday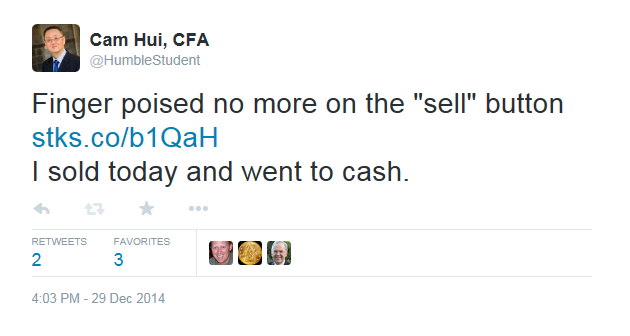
He is now short the market but watching the short-term indicators very closely. He agrees with Brett Steenbarger's analysis when Steenbarger found that momentum indicators were rolling over:
These measures leave me open to the idea that we've hit a momentum peak for the current cycle, which will have me looking closely at any bounces from here to see if we see waning or strengthening breadth. This could have longer-term ramifications, as it invites the hypothesis that the end of year strength was not a fresh leg in a bull market but rather part of a much larger topping process that began in 2014.
My inner investor believes that the current episode of market weakness is just a minor blip that can be ignored.
Disclosure: Long SPXU
