Trend Model signal summary
Trend Model signal: Risk-on
Trading model: Bullish
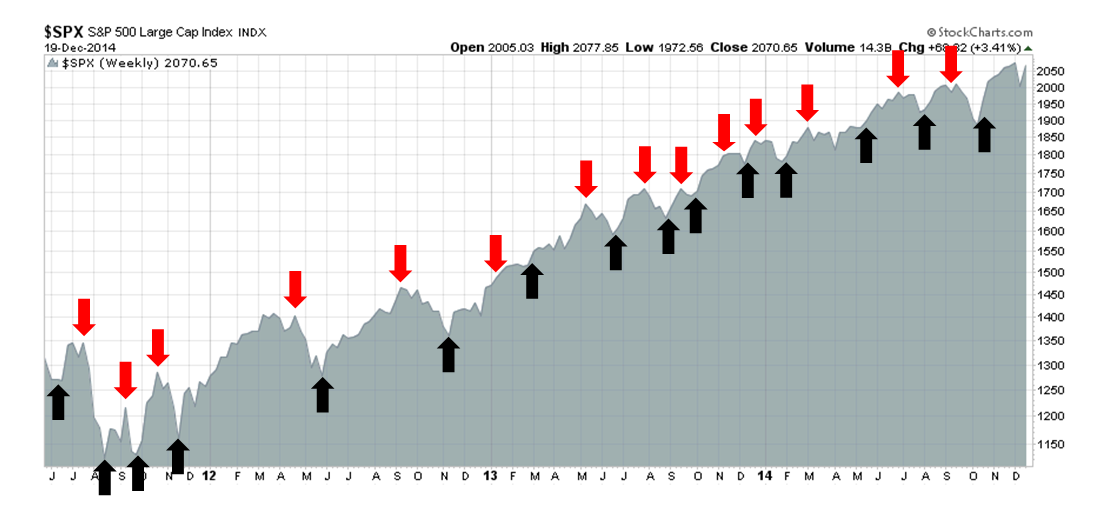
The Trend Model is an asset allocation model used by my inner investor. The trading component of the Trend Model keys on changes in direction in the Trend Model - and it is used by my inner trader. The actual historical (not back-tested) buy and sell signals of the trading component of the Trend Model are shown in the chart below:
Update schedule: I generally update Trend Model readings on weekends and tweet any changes during the week at @humblestudent. In addition, I have been trading an account based on the signals of the Trend Model. The last report card of that account can be found here.
Enjoy the Santa Claus rally, but...
I just have a relatively brief trading oriented comment as blogging will be light for the remainder of the week:
I have remained steadfastly bullish during the brief downturn in December and pounded the table to make the case for an oversold rally to begin (see Why today (Dec 9) was like the October bottom and Dear Santa, May I have new highs for Christmas?).
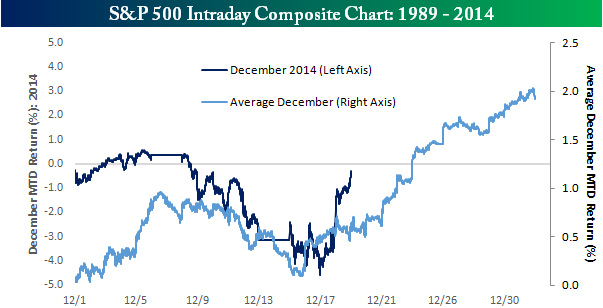
So far, the current rally has followed the typical seasonal pattern, as shown by Bespoke:
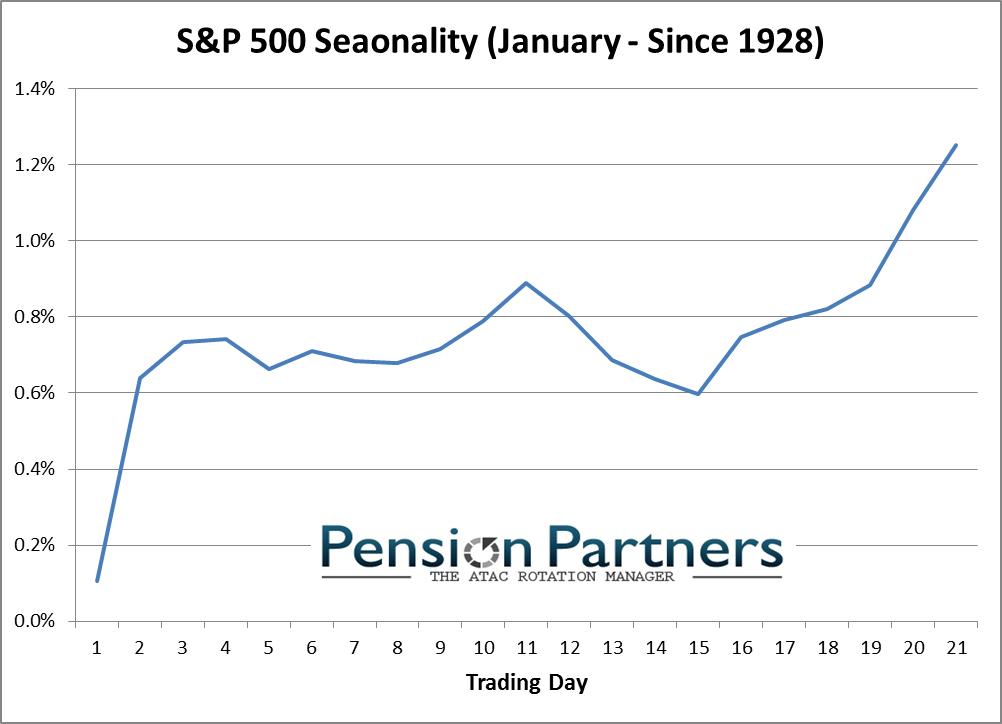
If history is any guide, the rally should continue into the early parts of January (via Pension Partners):
Warnings from overseas
However, I remain concerned as non-US markets are misbehaving and their market action is suggestive of economic weakness. Such signals have the potential to spook the global growth outlook once the seasonal rally peters out. In fact, it is only the combination of the short-term seasonal pattern and the recent oversold readings that have kept the Trend Model from moving to a more cautious reading.
Consider that, in Europe not only is growth anemic, Greek politics are in turmoil again. The latest presidential election faces an uncertain outcome (via Ekathimerini):
The government garnered 160 votes in the first round of crucial presidential elections on Wednesday, performing slightly worse than anticipated and increasing speculation about snap polls.
In addition to the 155 coalition MPs, five independents backed the government’s candidate, former European commissioner Stavros Dimas. Another 135 voted “present” while five were absent. The result was far short of the 200 votes required in the first round, a target that the government is also certain to miss in next week’s second round. However, ahead of the critical third vote on December 29 when the threshold drops to 180, the government had hoped to gain between 161 and 165 in the first round in a bid to build momentum for the votes to come.
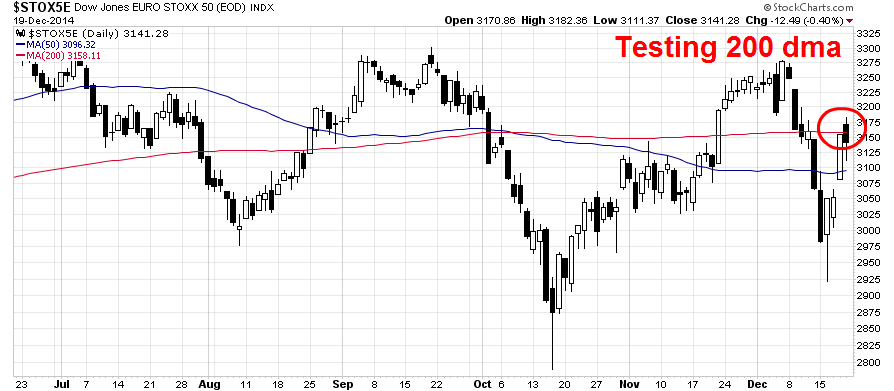
Should the third vote fail, it would mean parliamentary elections which would lead to a probable win by the far left SYRIZA party. As a result, the Euro Stoxx 50 has been extremely volatile:
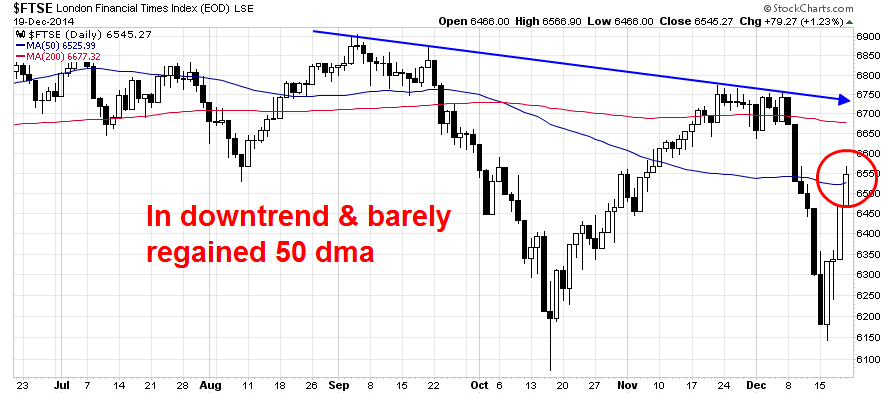
Across the English Channel, UK stocks are showing an even greater level of weakness. The energy heavy FTSE 100 is in a downtrend and the most recent rally barely regained the 50 DMA.
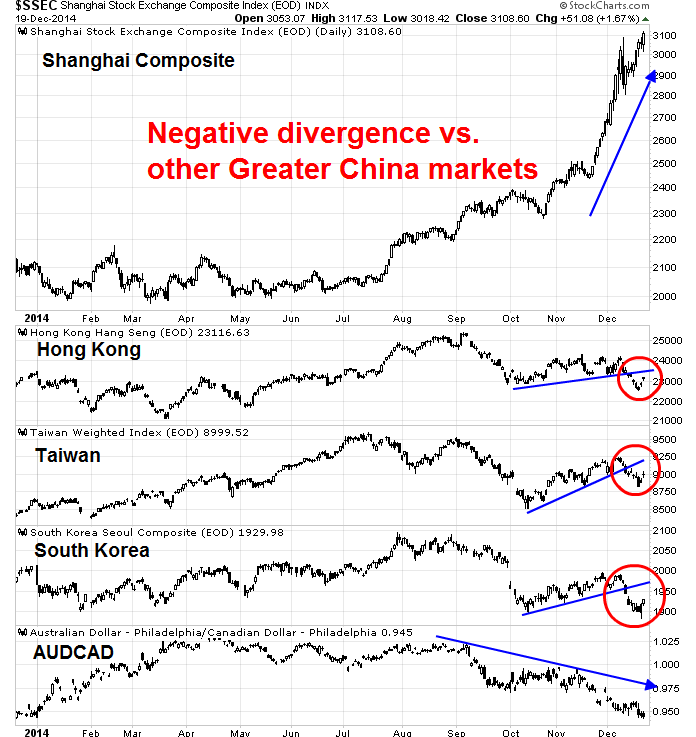
Moving to Asia, Mr. Market is also showing his concerns over the outlook for Greater China. The Shanghai Composite (top panel) has begun to pause from its recent rally as it appears that the parabolic rise is accounted mainly by speculative activity in the wake of the Shanghai-HK link-up. By contrast, the other regional stock markets of China's major Asian trading partners (middle panels) have not confirmed the strength in Chinese stocks as they have all broken their uptrends. In addition, the AUDCAD currency cross (bottom panel), which is important as both Australia and Canada are resource economies but Australia is more sensitive to Chinese growth, is tanking. These are all signs that the market is concerned about slowing Chinese growth.
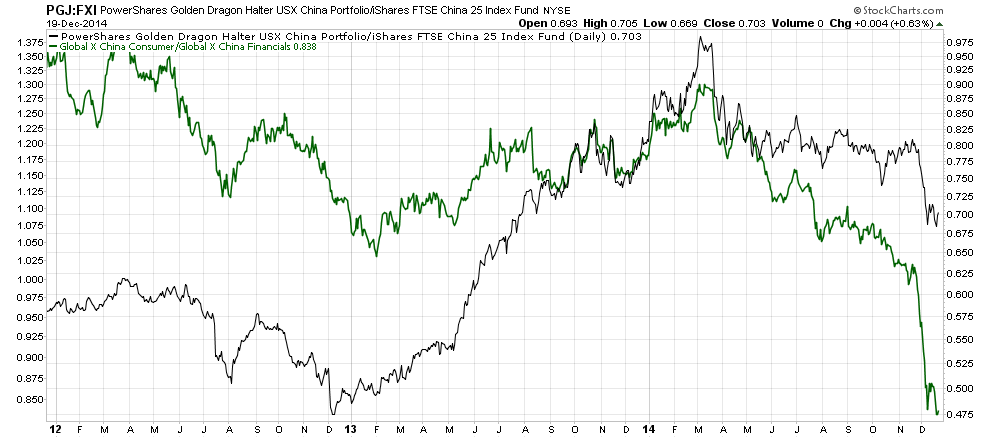
Another worry that I am seeing is the lack of signs that China is re-balancing its economy from credit-driven infrastructure growth to the consumer led growth. The chart below shows two relative return pair trades of New China to Old China, as measured by the Golden Dragon Halter USX China ETF (NYSE:PGJ)-iShares FTSE/Xinhua China 25 Index (ARCA:FXI) pair (in black) and Global X China Consumer (NYSE:CHIQ)-Global X China Financials (NYSE:CHIX) pair (green). By any measure, Old China is outperforming New China.
Is the Santa Claus rally sustainable?
With weakness evident in overseas markets, the key question is whether US equities can de-couple and continue to strengthen in the face of rising global worries. In other words, is the current US market rally just a seasonal snap-back rally after the weakness seen in early December, or is it more reflective of confidence of continued US economic growth?
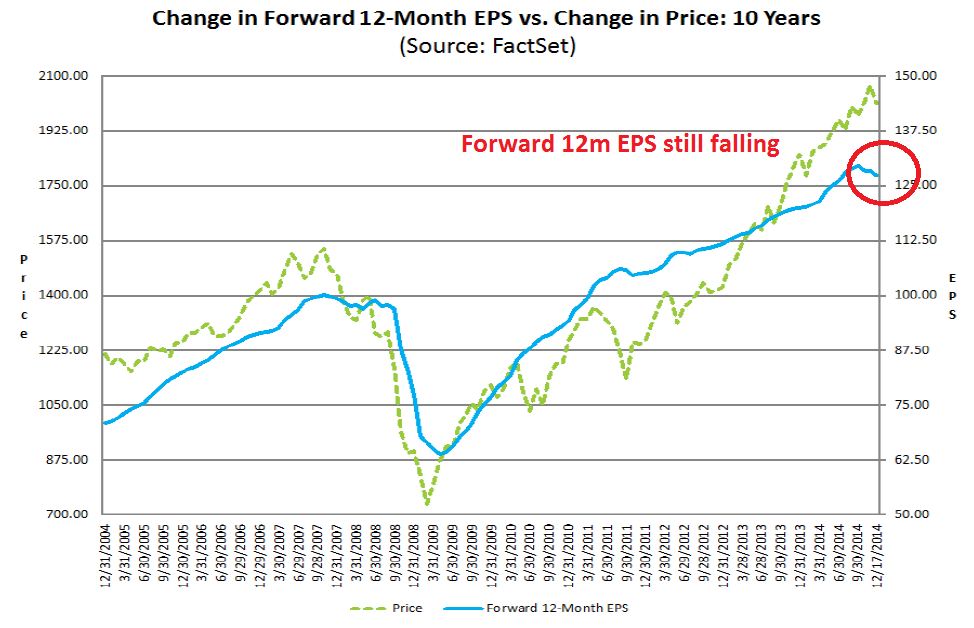
My base case scenario at this point is we are seeing a typical oversold rally from tax-loss selling which will stall out in early January. That`s because forward EPS estimates are falling, indicating the current lack of a fundamental backdrop for stock market strength. The latest weekly analysis from John Butters of Factset shows that forward EPS is still falling (annotations in red are mine). Such episodes have historically coincided with equity market weakness.
While I continue to believe that the Street will eventually raise growth estimates because of lower oil prices, these changes will occur with a lag because the analyst community haven't fully quantified the effects of falling energy prices (see 2015: Bullish skies with scattered periods of volatility). Corporate America will see eventually benefits from decreased input costs and higher consumer spending as oil prices decline. Indeed, New Deal Democrat highlighted analysis indicating consumer confidence is rising the most in the bottom 1/3 of the US population. Falling fuel prices are likely to act as an immediate wage boost (or tax cut) to that population segment, which would feed through directly to consumer spending:
Overall, the sentiment index rose to a higher-than-expected 93.8, mirroring levels seen in boom years like 1996 and 2004. The best part is that the biggest increase in optimism comes from the lowest 1/3 of households measured by income.
It's not too difficult to believe that lower gas prices and consistent job gains of over 200,000 a month, with unemployment under 6%, are finally having an effect.
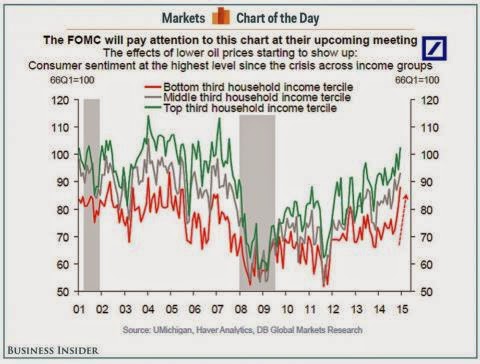
It`s just that EPS growth estimates have not risen much because the benefits of lower oil prices are diffuse and the Street hasn't quantified them yet.
Watching for the New Year hangover
Tactically, here is what I am watching. The key indicator to watch for the sign that the Santa Claus rally can continue into year-end and beyond is the nature of the market leadership during this period. Will relative strength led by the recent high-beta leadership, such as biotechs and semiconductors, which would be a sign of continued market strength, or down-and-out groups such as small caps and energy, which are the most likely tax-loss selling candidates and whose rallies would likely peter out soon?
The chart below shows the relative returns of these groups. If the beaten down groups like energy and small caps start to show relative strength, then the Santa Claus rally is most likely to be short-lived and traders should be wary of a post-New Year hangover. If, on the other hand, we see continued strength from leading groups like the biotechs and semiconductors, then the bull run is far more likely to continue.
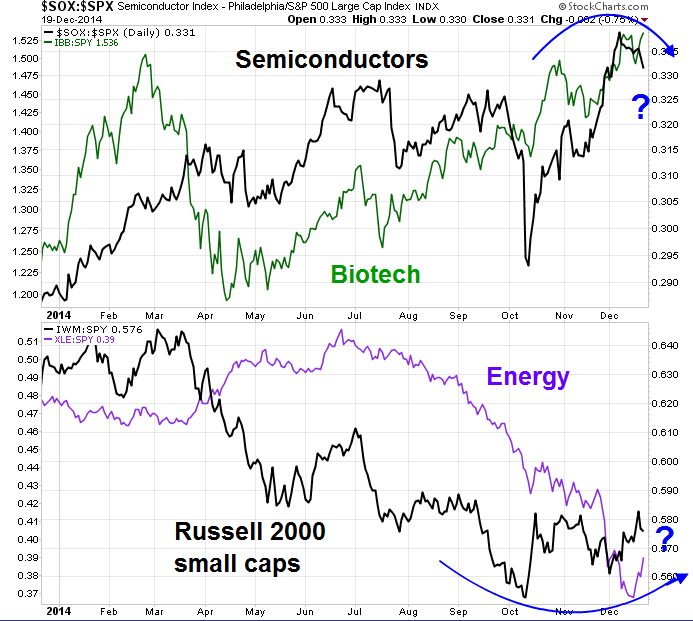
In the meantime, my inner trader remains long this market. He is nervously watching how foreign markets and US market leadership will behave in the next week or two.
Disclosure: Long SPXL, TNA
Cam Hui is a portfolio manager at Qwest Investment Fund Management Ltd. ("Qwest"). This article is prepared by Mr. Hui as an outside business activity. As such, Qwest does not review or approve materials presented herein. The opinions and any recommendations expressed in this blog are those of the author and do not reflect the opinions or recommendations of Qwest.
None of the information or opinions expressed in this blog constitutes a solicitation for the purchase or sale of any security or other instrument. Nothing in this article constitutes investment advice and any recommendations that may be contained herein have not been based upon a consideration of the investment objectives, financial situation or particular needs of any specific recipient. Any purchase or sale activity in any securities or other instrument should be based upon your own analysis and conclusions. Past performance is not indicative of future results. Either Qwest or Mr. Hui may hold or control long or short positions in the securities or instruments mentioned.
