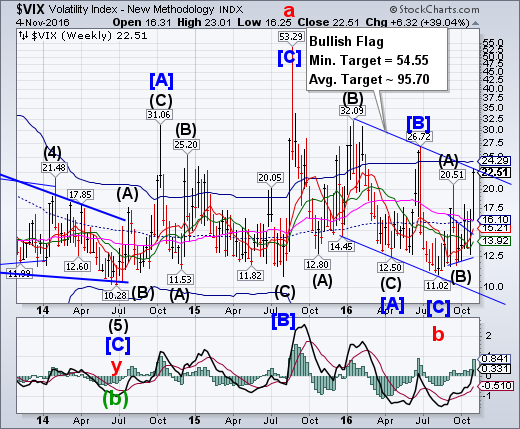
VIX rallied to the upper trendline of its Bullish Flag formation at 23.50.The next important milestones are the trendline and Cycle Top resistance at 24.29 where a long-term breakout of the Bullish Flag may occur and the Cyclical uptrend may resume in earnest.
(ZeroHedge) Stocks are now down Year-over-Year...
VIX up 8 days in a row (3rd time in history - 4 April 2012, Dec 2013), S&P down 8 days in a row (the longest losing streak since Lehman in Oct 08)
S&P 500 declines 9 consecutive days to Long-term support.
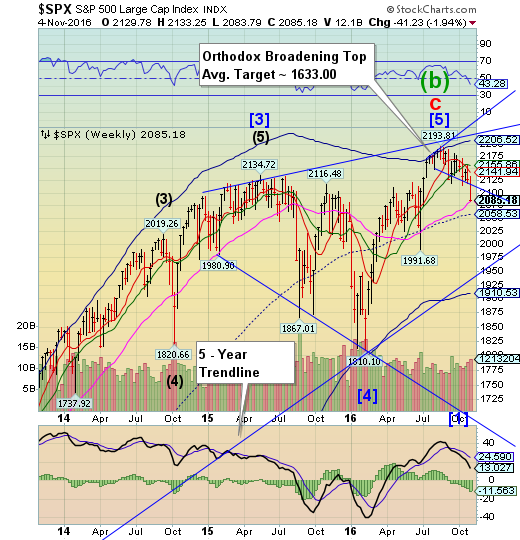
SPX declined this week to challenge weekly Long-term support at 2184.23. However, the more important item is that the Orthodox Broadening Top has been triggered at 2112.00. Broadening tops are often associated with panic declines.
(WSJ) A late afternoon slump dragged the S&P 500 to its ninth consecutive decline, its longest losing streak in nearly 36 years.
October employment data signaling solid momentum in the labor market and a bounceback in biotechnology shares had buoyed stocks for most of Friday’s trading session. Ultimately, however, caution prevailed in the final hour of trading. The tight U.S. presidential election has dragged down stocks and pushed up Wall Street’s “fear gauge” since early last week.
The S&P 500 declined 3.5 points, or 0.2%, to 2085, putting its nine-day decline at roughly 3%. The last time the S&P 500 index fell for nine days in a row was the period ending Dec. 11, 1980—when it lost 9.4%.
NDX declines, losing Intermediate-term support.
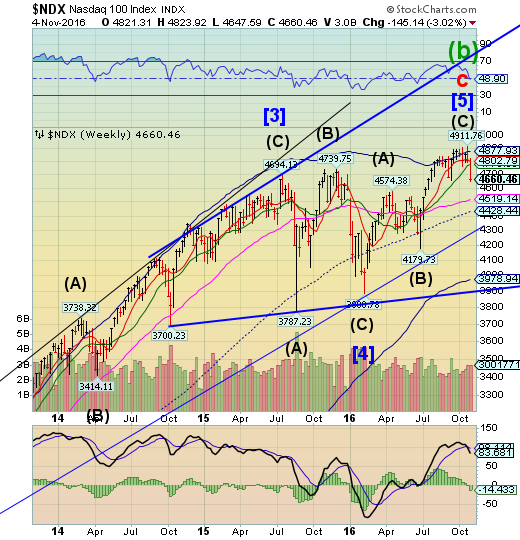
NDX declined beneath Intermediate-term support at 4776.36, confirming its sell signal.The decline beneath Intermediate-term support at 4768.59 confirms the sell signal. It may be imprudent to be long beyond this point.
(ZeroHedge) In the last week the so-called FANG stocks (Facebook Inc (NASDAQ:FB), Amazon.com Inc (NASDAQ:AMZN), Netflix Inc (NASDAQ:NFLX), Alphabet Inc (NASDAQ:GOOGL)) have stumbled. As earnings and outlooks disappointed, shareholders have awoken to the new normal low growth world and wiped over $100 billion in market capitalization of the four horsemen of the Fed's wealth creation bubble.
FANGs are now down 8 days in a row...
Losing a massive $108 billion in that time...
This is the biggest drop since the February growth scare - which was only saved by massive coordinated global central bank money-printing... which is simply not about to happen this time.
Dow Jones High Yield Select 10 challenges Long-term support.
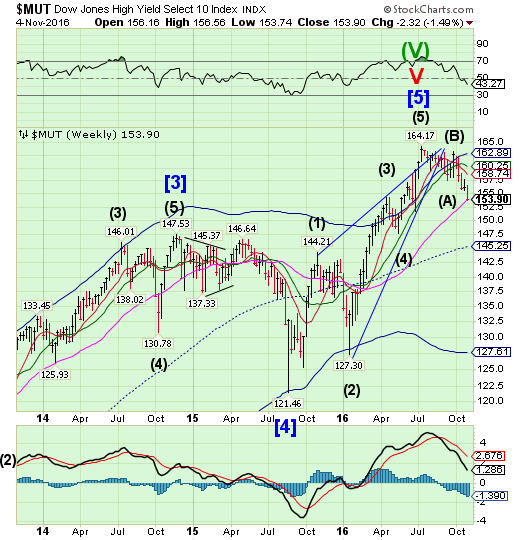
The High Yield Bond Index declined to challenge and close beneath Long-term support at 153.92. The Cycles Model suggests more selling ahead.Investors continue to rotate into corporate bonds (both IG and HY) as a potential safe haven, only to see further declines.
(Reuters) Investors poured $3.9 billion into U.S.-based bond funds, a trade group's data showed on Wednesday, dealing the funds their 17th straight week of nettingnew cash shortly before a major corporate debt selloff.
Bonds have been a popular bet this year, winning $123 billion from U.S.-based mutual fund investors and $70 billion for exchange-traded funds in that segment through September,according to earlier data from the fund industry's Investment Company Institute.
Markets have rewarded those investors, especially those willing to bet on long-term bonds and speculative debt in the beginning of the year.
USB consolidates in an inside week.
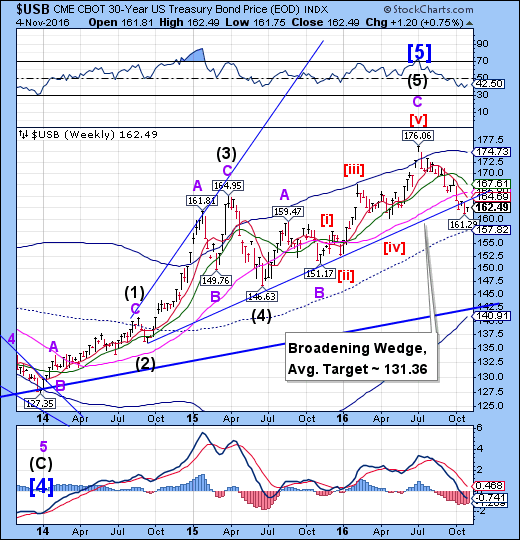
The Long Bond consolidated in an inside week after breaking its 15-month trendline. The Cycles Model suggests there is still time for a further decline, rather than a rally, possibly to mid-November. The space to fill may be the breach between the current price and the mid-Cycle support at 157.82. However, a panic may propel USB to its 35-year trendline at 142.50.
(WSJ) The U.S. bond market ended the first week of trading in November on a high note, regaining some poise after October’s biggest monthly selloff in more than a year.
A main boost this week for haven debt is growing concern over next week’s U.S. presidential election, with polls increasingly pointing to a tighter race. The uncertainty is driving many investors to shed risk appetites and preserve capital in relatively safer assets including Treasury bonds and gold.
On Friday, the VIX index, or the fear gauge on Wall Street, reached the strongest level since late June, a sign investors are worried about large price fluctuations in U.S. stocks.
The iShares MSCI Europe IMI (TO:XEU) retests resistance.
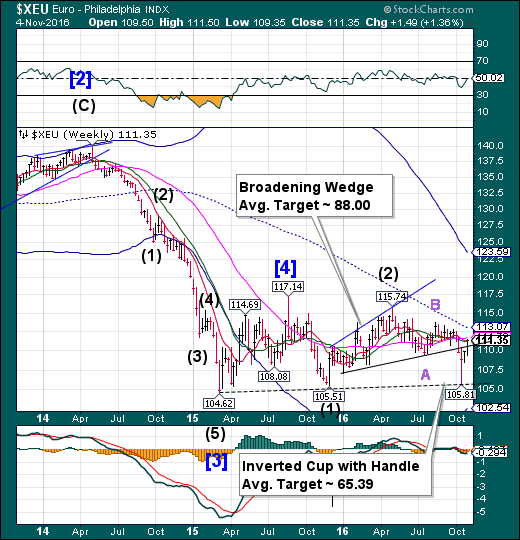
The Euro attempted a retest of the weekly Long-term resistance at 111.72, but did not reach it. That may be the extent of the bounce, as the Cycles Model suggests that its short-term period of strength may be over. We may see the decline resume next week with a significant low in about three more weeks.
(Forbes) International political and economic news in recent weeks was filled with stories and analyses of the United Kingdom referendum to leave the European Union (EU). The immediate results of the vote included the resignations of the British Prime Minister and other government leaders, as well as a substantial decline of the foreign-exchange value of the British currency. Because the United Kingdom was not a part of the Eurozone (countries which share a common currency provided by the European Central Bank,) the British referendum to leave the EU was not a vote to also leave the euro. However, the decision by a majority of British voters will have significant implications for the viability of the euro.
Euro Stoxx 50 loses its grip.
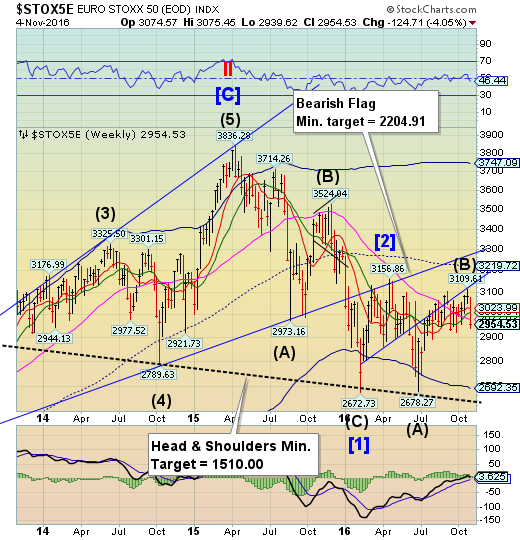
The Euro Stoxx 50 Index could not find any traction as it declined beneath three separate support levels.The Cycles Model suggests more selling next week is probable. The Head & Shoulders formation may soon come into play as Stoxx decline. The financial media are calling for a bottom a little too quickly.
(Bloomberg) European stocks have fallen so much that they reached a technical level signaling a rebound may be around the corner.
The Stoxx Europe 600 Index slid 0.8 percent, marking an 11th consecutive day without gains for the first time since 1994. This week was particularly brutal, with concerns about the outcome of the U.S. presidential election sending the gauge to its worst plunge since the February rout.
But the losses might just have gone too far: The Stoxx 600’s relative strength index hit a level that analysts call oversold, indicating that investors could have bailed on shares too eagerly. At the same time, European equity funds finally snapped a record 38-week run of outflows, according to a Bank of America Corp report citing EPFR Global data.
The Yen bounces to resistance.
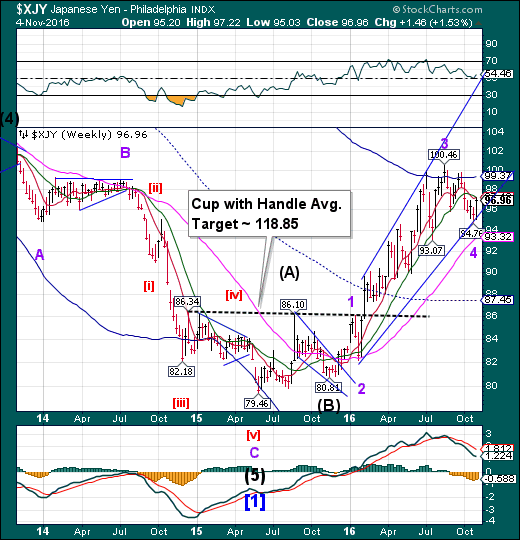
The Yen appears to have bounced from its rising trendline toward its Intermediate-term resistance at 97.27.The turn in the Yen has finally arrived on Monday. With it, a new period of strength appears to have emerged, possibly lasting through the election.A breakout above the high at 100.46 confirms the next move may be dramatically higher.
The media is still discussing the Yen decline.
The Nikkei gives up a three week’s gains.
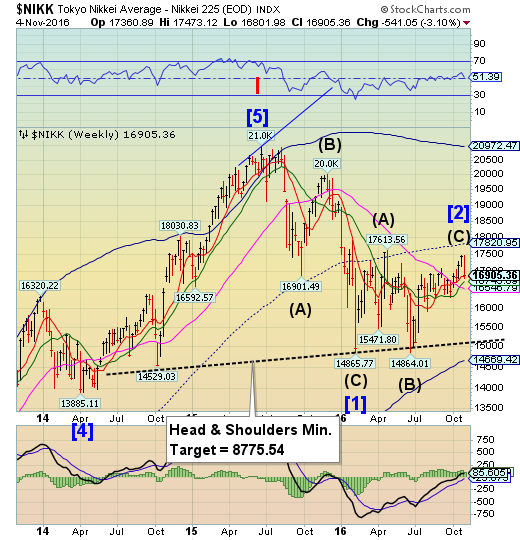
The Nikkei reversed course, as suggested last week, challenging Short-term support at 16882.41.Last week I had mentioned that it had reached the technical limit of its retracement. Inversions have a tendency to retrace themselves, either partially or fully, in a very short time period following the inversion period. Should the Head & Shoulders neckline be broken, a panic decline may ensue.
(Bloomberg) Japanese shares dropped, with the benchmark Topix index capping its worst week since July, as escalating jitters over the outcome of the 58th U.S. presidential election next week pushed the yen higher.
The Topix fell in Tokyo on Friday after a holiday, with the measure losing 3.3 percent this week. The Japanese currency rose against the dollar for a third day on Thursday, while the S&P 500 Index slid for an eighth day in its longest streak of losses since the global financial crisis, as fresh polls put Democrat Hillary Clinton only slightly ahead of Republican Donald Trump.
US Dollar Index declines toward support.
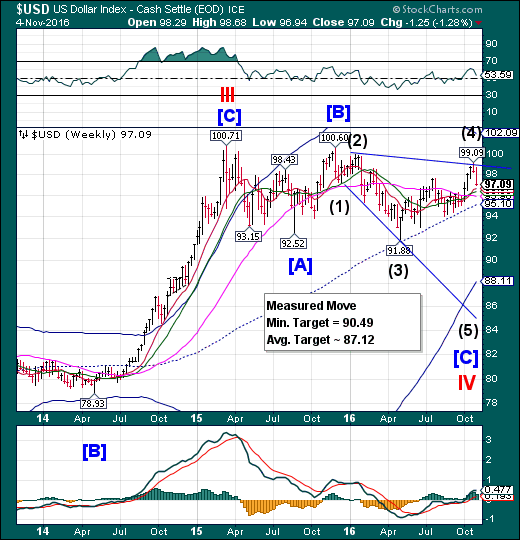
USD declined toward the cluster of supports between 95.10 and 96.67. The next week may see the heretofore bullish trades be unwound as these supports are broken. The unwinding of those trades may cause a rapid move from bullish to bearish as traders find themselves wrong-footed.
(Reuters) Speculators increased positive bets on the U.S. dollar for a sixth straight week, with net longs touching their highest in more than nine months, according to Reuters calculations and data from the Commodity Futures Trading Commission released on Friday.
The value of the dollar's net long position advanced to $20.78 billion in the week ended Nov. 1, from $18.81 billion the previous week. This week's net long dollar position was the largest since late January.
Over the last few months, the dollar's positive momentum has been driven by expectations the Federal Reserve will hike rates next month. An October U.S. non-farm payrolls report on Friday was generally viewed as positive overall despite coming out lower than expected with 161,000 jobs created.
Gold may have hit the apex of its retracement.
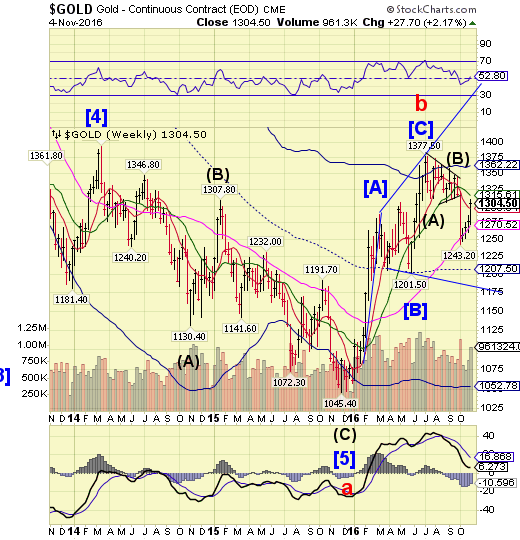
Gold surged to 1308.30 on Wednesday, but must now make a low in the next two weeks. The Cycles Model suggests that the decline may resume imminently. The next two weeks may be dramatic.
(Bloomberg) Even the prospect of higher U.S interest rates hasn’t been enough to faze gold bulls as angst over the U.S. election puts the metal on course for a fourth straight weekly gain.
Gold had its longest weekly rally since July, with buyers undeterred as a report showing steady progress in the U.S. labor market strengthened the case for higher interest rates. Investors are seeking haven assets, with the MSCI All-Country World Index sinking to an almost four-month low and industrial metals such as aluminum and zinc falling.
Crude declines through Intermediate-term support.
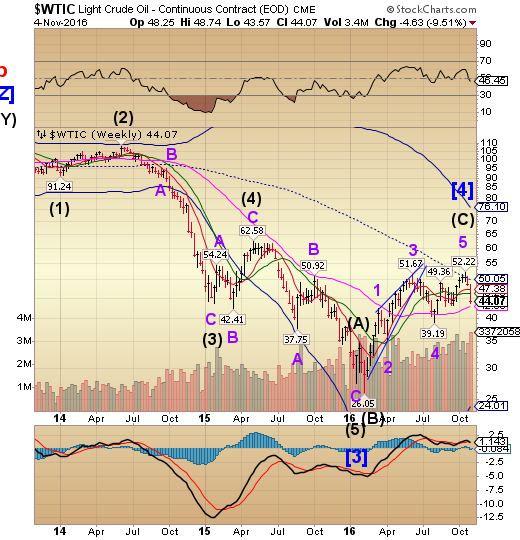
Crude continued its decline through Intermediate-term support at 46.23. Long-term support may be the next to fall.There is now the probability of an imminent decline that may test the February low. After 6 months of being range-bound, traders may not have seen this decline coming.
(Reuters) Money managers cut their bullish wagers on U.S. crude for the second straight week to the lowest in a month, data showed on Friday, as traders and investors turned increasingly skeptical that OPEC would deliver on its aim to trim output.
The speculator group cut its combined futures and options position in New York and London by 41,323 contracts to 227,655 during the week to Nov. 1, the U.S. Commodity Futures Trading Commission (CFTC) said. That was the lowest since early October.
During that period, U.S. crude oil prices plunged more than 6 percent.
Shanghai Composite makes a marginal new high today.
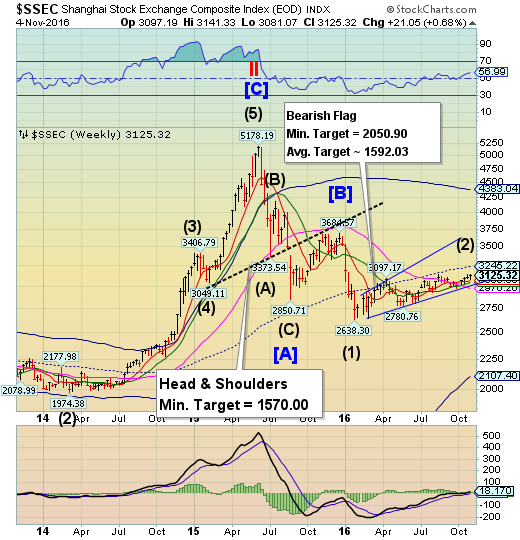
The Shanghai Index ended its attempt at a new high until today, when it hit 3141.33.It is now “in the window” for a strong decline, possibly a panic.The fractal Model suggests the Shanghai is due for another 1,000 point drop, possibly starting next week. The next Master Cycle low may be due by mid-November.
(ZeroHedge) Last September, when we predicted that Chinese consumers, investors and savers would flock to bitcoin as a medium of facilitating capital outflows (it was trading at $230 then, it is now three times higher), we also warned that bitcoin's upside would ultimately be capped by Beijing, when China's authorities realized how the digital currency was being used to bypass capital controls, and launch a crackdown on bitcoin, as they have with most other capital outflow measures .
It appears that the time has come because, as Bloomberg reports, China’s regulators are studying measures to limit transactions that use bitcoins to take funds out of the country, citing people familiar with the matter.
The Banking Index reverses.
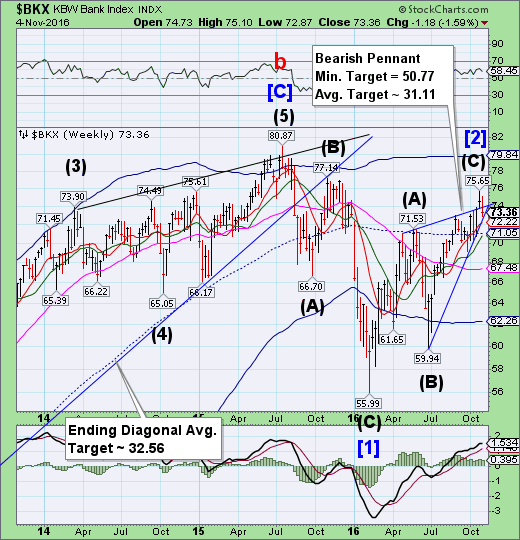
BKX reversed to the lower trendline of its Bearish Pennant, as suggested last week.A sell signal may be made beneath weekly Short-term support and the trendline at 72.22. Once broken, we may expect to see a very sharp (panic) decline.
(WSJ) Agricultural Bank of China, one of the country’s largest banks, agreed to pay a $215 million penalty Friday to resolve allegations by New York’s banking regulator that the lender violated anti-money-laundering laws.
The New York Department of Financial Services accused the bank of deliberately disguising transactions routed through its New York office that could have hidden laundering of illicit funds or violations of U.S. sanctions laws. Officials at the bank obfuscated U.S.-dollar transactions and failed to update the bank’s compliance controls, the department said in a civil consent order filed Friday.
Representatives for the bank didn't immediately respond to a request for comment.
(ZeroHedge) In the Legal Actions section of its just filed 10-Q, Wells Fargo (NYSE:WFC) confirmed that the bank is the object of an SEC probe, as well as various other government, state and local agencies are looking into its sales practices and reported that a "a number of lawsuits have also been filed by non-governmental parties seeking damages or other remedies related to these sales practices."
(ZeroHedge) Remember Deutsche Bank? It seems 'hope' for a deal - and a capital raise - are fading fast.
The last few days have seen the stock of the most systemically dangerous bank in the world tumble over 11% catching back down to the credit market's reality...
And 5Y CDS is surging back towards record highs.
(ZeroHedge) Over the weekend, we presented an excerpt from the latest weekly note by One River Management's Eric Peters, in which he shared an look into hedge fund psychology, explaining why despite the market being at all time highs, nobody has any faith in said "market any more:
“My company is in structural decline,” he said gazing across Gotham, high in the corner office. “Made it through denial, anger, bargaining, and given that we’re having this conversation, I suppose I’m mostly through depression.” Which leaves the final stage of grief and loss; acceptance.
The transition from active management to passive has been devastating for those who’ve devoted their lives to the former.
“I wonder whether the deep pessimism that we confront every day in our own businesses helps explain why we’re so skeptical of all time S&P highs.”
