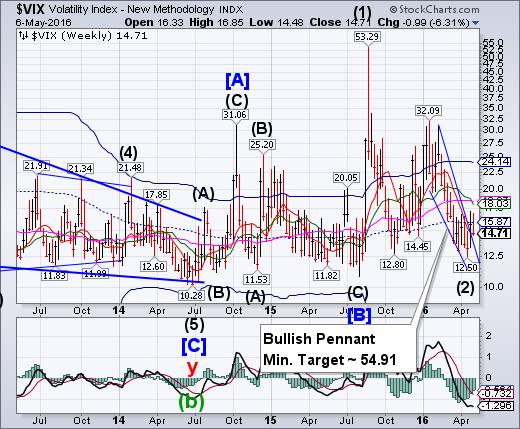
VIX challenged its weekly mid-Cycle resistance at 15.87, but pulled back and closed just above its Pennant formation. This maintains a potential aggressive buy signal (NYSE sell signal). A breakout above the weekly high at 17.09 may confirm the signal. Further confirmation lies at the double resistance at 18.03.
(SeeItMarket) The Volatility Index (VIX) is followed by most active investors and traders as a way of understanding the market’s sentiment toward stocks. It’s often referred to as the “Fear Index”. When it is really low, it signals complacency and sends a VIX warning to stocks. When it is high, it indicates fear in the market and the potential for a near-term momentum bottom in stocks.
Currently, market volatility is clocking in around 15 and resting a few points above its 2016 lows. So did the early action in 2016 send another VIX warning to stocks?
SPX declines to its “shelf of support”.
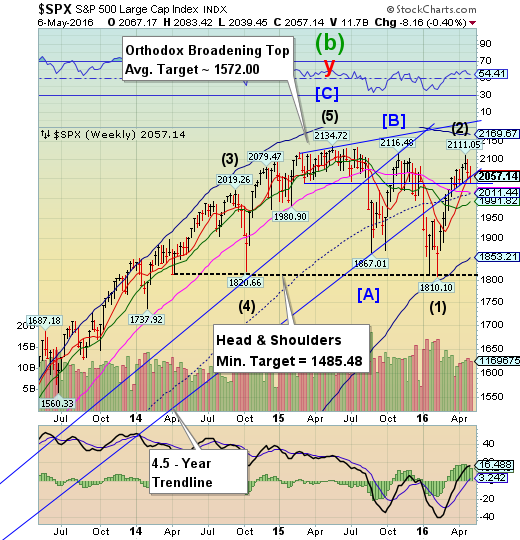
The SPX broke through its 4.5-year trendline and weekly Short-term resistance at 2058.09, closing beneath both. The uptrend is now in question, as I indicated last week. A decline through the Broadening Top trendline at 2045.00 sets up a probable loss of key support as well as a loss for this calendar year. A reversal beneath the “shelf of support” it implies may constitute a sell signal on the SPX. Trendlines are important support areas that often attract, then repel the markets.
(CNBC) U.S. stocks closed higher Friday, amid gains in oil prices, after the headline figure in the April employment report missed expectations.
The major averages reclaimed opening losses to close near session highs, with the Dow Jones industrial average up nearly 80 points and the S&P 500 up slightly as materials led most sectors higher while utilities lagged.
However, both indexes posted slight weekly declines for their first two-week losing streak since the one ended Feb. 12. The Nasdaq composite fell 0.8 percent for the week for its first three-week losing streak since the one ended Jan. 15.
NDX bounces a second time at Intermediate-term support.
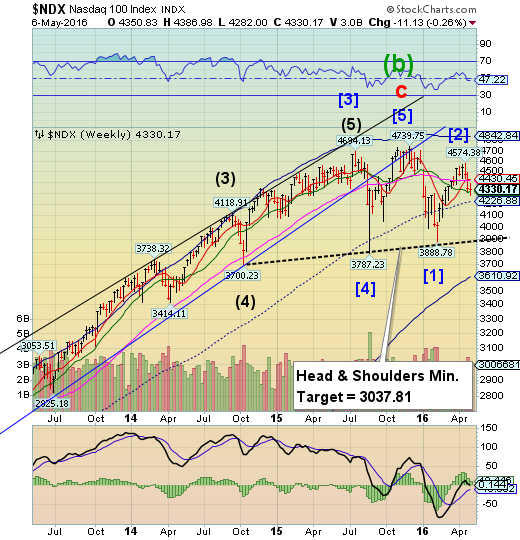
NDX bounced at the declining Intermediate-term support at 4313.32 a second time, but closed above it. NDX may now be on a sell signal after declining through Long-term support at 4430.45. The Head and Shoulders formation may be in play once NDX declines through its mid-Cycle support at 4226.88.
(RealInvestmentAdvice) It has been interesting as of late reading the numerous views espousing the value of “indexing” and lamenting the short-term underperformance of some fund manager. What is more interesting is a large majority of these individuals have only been involved in the markets post-financial crisis. In other words, many of these individuals have never lived through a 2000 or 2008 type financial market event.
It is only during these periods where true investment “metal” is tested as the battlefield becomes a vast wasteland of bodies and failed ideas. Despite strategies that promote the value of long-term investing and the benefits of indexing, it is the realization of “loss” that derails even the most well-intentioned of individuals.
Should I Stay…Or Should I Go?
High Yield Bond Index closes beneath key support.
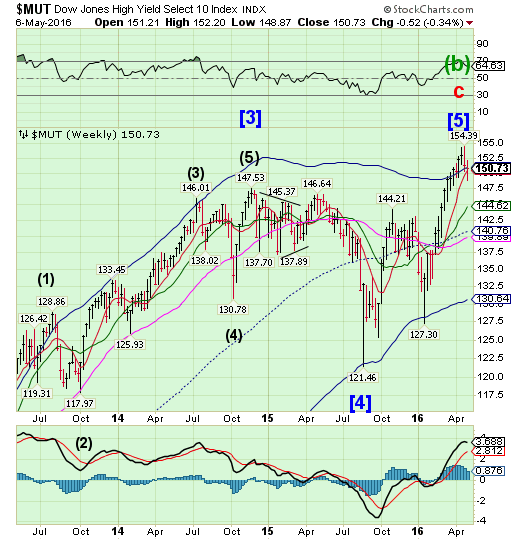
The High Yield Index broke through its Cycle Top support at 150.89, closing beneath it. It has also completed an important reversal pattern. This may be construed as a sell signal for High Yield Bonds. Major investment firms going bullish after a rally such as this should be taken as a warning.
(ZeroHedge) BofAML's Mike Cantopoulos' distaste for corporate fundamentals, displeasure with the efficacy of QE and easy monetary policy on spurring growth and inflation, and concerns that a further deterioration in credit conditions will create deeper economic troubles not appreciated by many have left credit markets with poor default adjusted valuations and little room to absorb a negative shock. He highlights nine key reasons below why BofAML believes this rally won't last (and in fact may have already seen its end).
As BofAML explains, we continue to hold this bearish view in the face of a market rally that has wiped out all the widening from December through February 11th. In fact, one could go so far as to say we are not only just as bearish as ever, but perhaps more so, as earnings disappoint and economic weakness appears to be broader based than we have seen since the recession, yet the Fed, in all likelihood, will likely be compelled to hike rates despite these problems.
The euro is still in an uptrend.
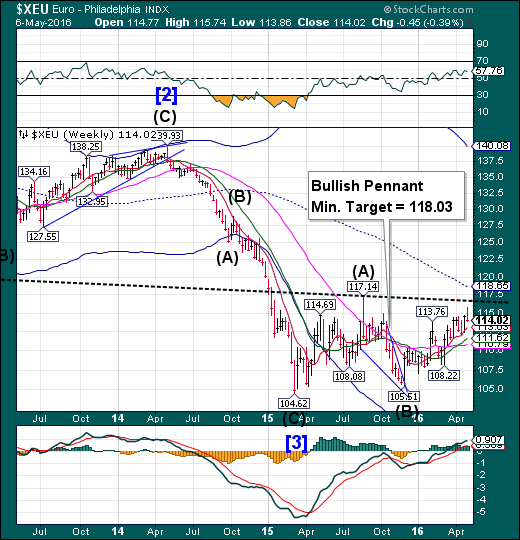
The euro may be pulling back this week but is still above uptrend support at 113.02. It appears that the euro may be reviving enough to break above its trendline at 117.00. The near-term target appears to be 118.03. Should it remain above the trendline a higher target may await the euro.
(ZeroHedge) According to a recent survey, the majority of people in Germany view the news media as simply a pillar of the government and the powerfully elite. Only one third of the respondents think that the German news media is truly independent, while the majority view the government and parties as having control over particular policies, and the lobbyists and advertisers having control over the economic news.
More than half of the respondents viewed the news media as controlled by the "powerful" in the country, a view which manifested in recent years in the wake of going through crisis after crisis as the media began to be viewed simply as part of the system, or, the Fourth Estate.
EuroStoxx declines beneath Intermediate-term support.
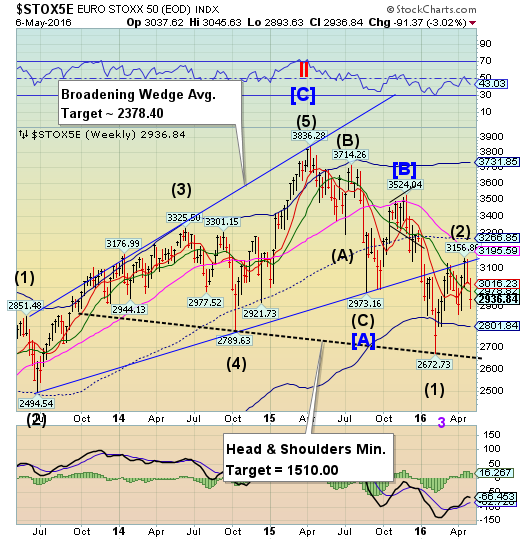
The EuroStoxx 50 Index declined beneath Intermediate-term support at 2978.82. The index is now on a sell signal.The decline may not stop at the Cycle Bottom, but rather challenge the Head & Shoulders neckline at 2650.00. A short-term low may form as early as next week.
(MarketWatch) European stock markets ended a choppy session mostly lower on Friday, with a downbeat reading on U.S. jobs growth outweighing a late-day rally in oil prices.
The Stoxx Europe 600, -0.36% fell 0.4% to close at 331.67, ending down 2.9% for the week—marking the worst weekly performance for the pan-European benchmark since the week ended Feb. 12, FactSet data showed.
Big U.S. jobs miss: European stocks already were lower from the beginning of the trading day, but losses sharpened after the weaker-than-expected jobs number from the U.S.
The yen ramps beyond its Pennant objectives.
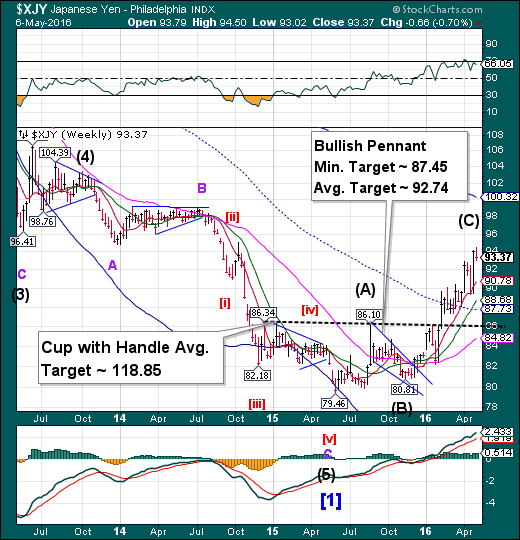
The yen continues to rally in a new Cycle pattern. It may rally at least another week before the next pullback or reversal. The inverted Cup with Handle formation appears to be activated. While the Cup-with-Handle target may seem far-fetched, the Cycle Top at 100.49 may be attainable as a minimum target.
(WSJ) The Japanese government wants sympathy from its peers for its efforts to intervene in a rallying currency. There’s just one problem: The yen is still at historic lows against its trading partners.
That could blunt Japanese Prime Minister Shinzo Abe’s message when he meets with Group of Seven leaders later this month, a summit at which he intends to discuss exchange rates. Mr. Abe said at a news conference on Thursday that Japan would respond to the “drastic fluctuation” in the exchange rate that is making life harder for Japanese exporters.
The Nikkei gaps beneath Intermediate-term support.
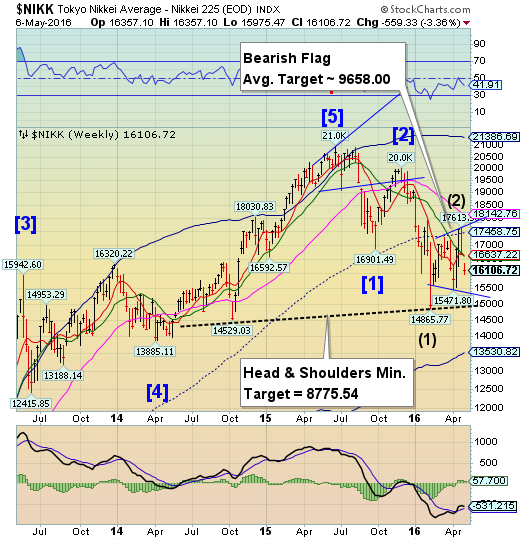
The Nikkei gapped beneath weekly Intermediate-term support at 16637.22 on Monday and hasn’t looked back. The decline may develop into a panic as the next support may be the Head & Shoulders neckline near 15000.00, followed by the Cycle Bottom at 13530.82.
(Reuters) Japanese stocks fell on Friday as caution prevailed ahead of a U.S. jobs report, while investors also worried about the impact of a strong yen on corporate profits.
The Nikkei share average declined 0.3 percent to 16,106.72 in its first day of trade following a three-day closure for national holidays. Japan's benchmark index ended the short trading week about 3.4 percent lower.
During the holiday closure, the yen climbed to a fresh 18-month high against the U.S. dollar, hurting the outlook for exporters and a broad swath of other shares that benefit from a weaker yen.
U.S. dollar bounces off mid-Cycle support.
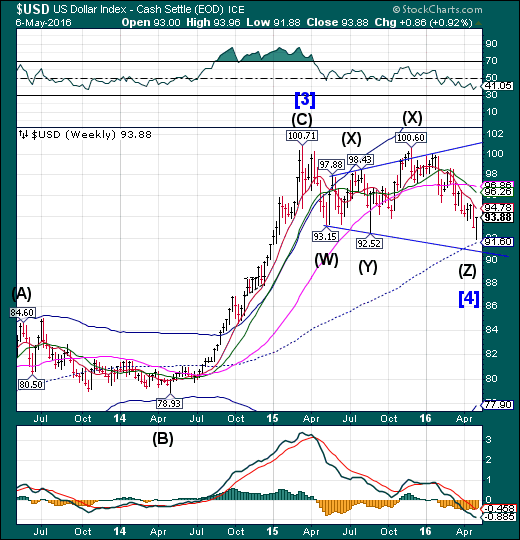
USD bounced off the weekly mid-Cycle support at 91.60. It has yet another probe lower to its Broadening trendline at 90.40. Thereafter, a strong rally may develop.
(MarketWatch) The dollar ended Friday higher against the euro, though it notched a slight decline against the yen, after a volatile session that saw investors struggle to determine exactly how the Federal Reserve would interpret a report on April jobs growth.
Official data showed the U.S. economy created far fewer jobs last month than economists had expected, triggering a knee-jerk selloff in the U.S. currency.
The report, released at 8:30 a.m. Eastern Time, showed the U.S. economy added only 160,000 jobs last month—far lower than the 193,000 jobs expected according to a survey of economists conducted by MarketWatch. Readings on jobs growth in March and February were also revised lower.
USB resumes it rally.
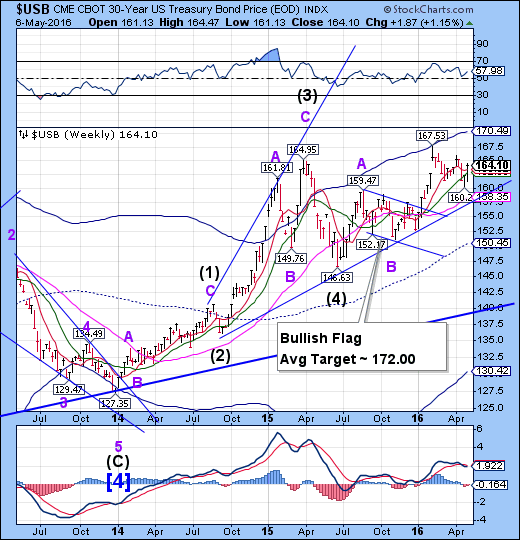
The Long Bond rallied above weekly Intermediate-term resistance at 162.83 in a show of strength. USB appears to be due for its all-time high in the next week. Bonds have not been this overpriced (historically lowest yields) in over 300 years.
(WSJ) U.S. government bonds strengthened Wednesday for a second consecutive day as a disappointing labor market release and lower stocks stoked demand for haven debt.
The bond market briefly pulled back on a solid gauge of the service industry, but buyers stepped in, sending the yield on the benchmark 10-year Treasury note to settle at the lowest level since in nearly three weeks.
The yield on the 10-year note was 1.786%, compared with 1.800% Tuesday. Yields fall as bond prices rise
Gold extends for a probable new target.
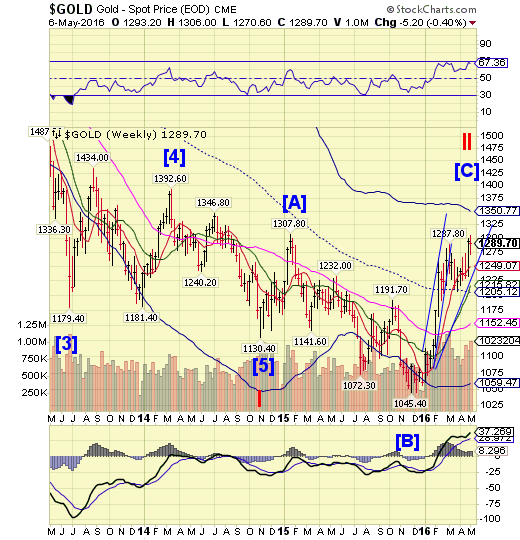
Gold made a small pullback after a new retracement high at 1306.00 on Monday. This may allow yet another probe to the weekly Cycle Top at 1350.77. This rally is extended enough that a decline beneath Short-term support at 1249.07 may be the first indication of a reversal.
(Reuters) Gold jumped 1 percent on Friday after U.S. non-farm payrolls data for April came in weaker than expected, boosting expectations the Federal Reserve will delay further interest rate increases.
Bullion prices pared gains later in the session as the U.S. dollar turned higher against a basket of major currencies and New York Fed President William Dudley told the New York Times that two rate hikes in 2016 remain a "reasonable expectation."
Crude lingers near its high.
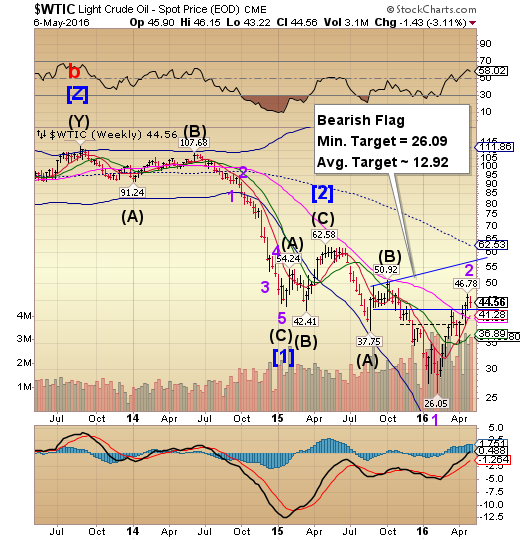
Crude pulled back from its highs, but remained above a critical support at 42.50. A technical limitation may have been reached and a reversal in crude prices is overdue. A decline beneath Long-term support at 41.28 may trigger a sharp decline in crude.
(MarketWatch) Oil futures logged a gain Friday as wildfires in an oil-rich region of Canada and an attack on a Chevron-operated offshore oil facility in southern Nigeria fueled concerns about global crude-output disruptions.
Those factors—bullish for oil prices—outweighed a disappointing jobs report showing companies added 160,000 new jobs to the U.S. workforce in April, compared with economists’ forecasts of 203,000, according to the Labor Department.
A weaker jobs reports suggests tepid demand for oil.
The continued spread of forest fires in Alberta, which started late Sunday, has resulted in the evacuation of some 8,000 people and threatens to cut nearly a million barrels a day from global supplies, analysts said.
Shanghai Index has lost all technical supports.
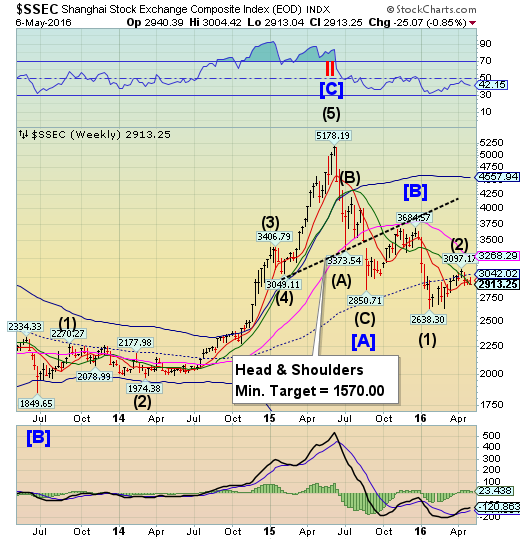
The Shanghai Index has now lost its weekly Intermediate-term support at 2918.60. After a failed stab at mid-Cycle resistance, the decline has begun. This action may confirm a sell signal in the Shanghai. There is no visible support beneath the prior low at 2638.30.
(ZeroHedge) As we detailed recently, in addition to its sub-prime debt crisis, China is dealing with an issue that is just as troubling, if not more so: Porkflation. Due to a drop in global production of pig meat, pork prices in China have been skyrocketing at both the wholesale and retail levels.
Porkflation is a very delicate, and very concerning issue for China. The massive amounts of layoffs that China has experienced as a result of a slowing economy has already lead to some social unrest, and pork prices exploding higher for those unemployed will only add fuel to that simmering fire. Social unrest is something that we've been discussing for quite some time as a critical risk factor in China, something that the mainstream media continues to overlook (primer here). As a reminder, the number of strikes that China has experienced has significantly grown over the years, and a growing social unrest is something that the government does not want to deal with, especially as the economy implodes and needs to be the focus for now.
The Banking Index bounces at Short-term support.
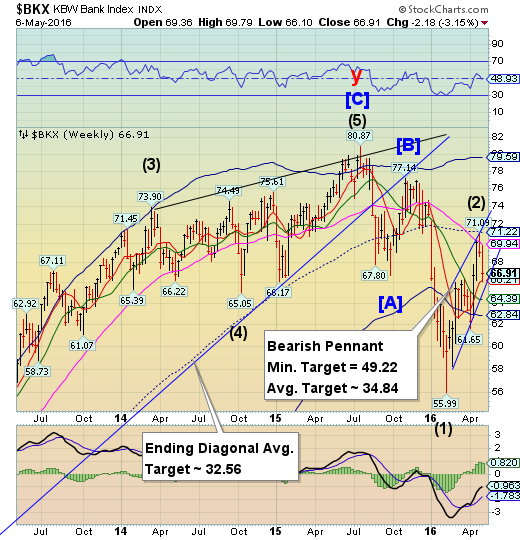
BKX fell through Long-term resistance at 69.94, but bounced at Short-term support at 66.21. The Pennant trendline is the next support.Should the decline continue, the next significant low may be due by mid-May.
(FederalTimes) A new Government Accountability Office report has found that one of The Great Recession’s most enduring relief programs still has 16 banks struggling to leave it eight years later.
The Capital Purchase Program, part of the broader Troubled Asset Relief Program, has largely wound down with 691 of the original 707 eligible financial institutions having paid off their debts.
(WSJ) In the pursuit of order in its financial markets, China’s banking regulator has tended to be one step behind in keeping up with a decade-long dalliance between commercial banks and the country’s non-bank lenders, called the shadow banking sector. Its latest directive suggests the government might finally be trying to get ahead.
Bankers and analysts say the China Banking Regulatory Commission issued a notice to commercial lenders last week, taking aim at a shadow-banking product that has allowed banks to hide loans, including bad ones, from their books.
(ZeroHedge) While one of the recurring complaints about the US consumer has been the willingness to dig into their savings which recent matched the highest level since 2012, something unexpected was revealed today when the March Consumer Credit data showed that not only did total consumer credit soar by $29.7 billion, or almost double the $16 billion expected, and the highest in series history...
(ZeroHedge) In an oddly ironic twist, today Donald Trump announced that he has picked as chairman of his newly launched fundraising operation none other than a former employee of the bank he has repeatedly criticized in the past, and which he used as a foil to criticize Ted Cruz: Goldman Sachs (NYSE:GS).
Trump announced that heading up his own personal fundraising operation as national finance chairman will be Steven Mnuchin, a long-time business associate, chairman and CEO of the hedge fund Dune Capital. More importantly, however, he spent 17 years at Goldman Sachs where he was most recently a Partner, having built a fortune of $46 million before launching his own hedge fund.
