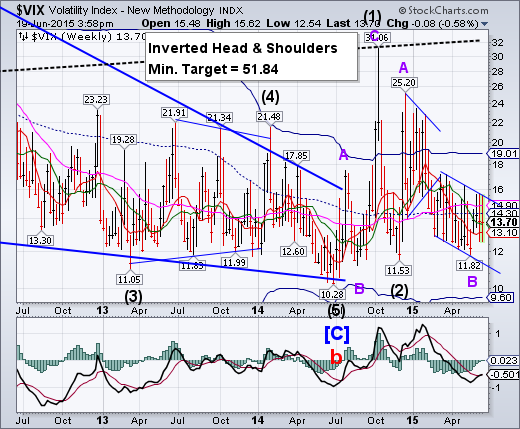
--VIX closed above Short-term support at 13.10 and Intermediate-term support at 13.63, maintaining the aggressive sell signal for SPX. A breakout above its prior high at 15.74 will announce the resumption of the rally in VIX, and confirm the sell signal in the SPX.
SPX closes beneath Short-term support.
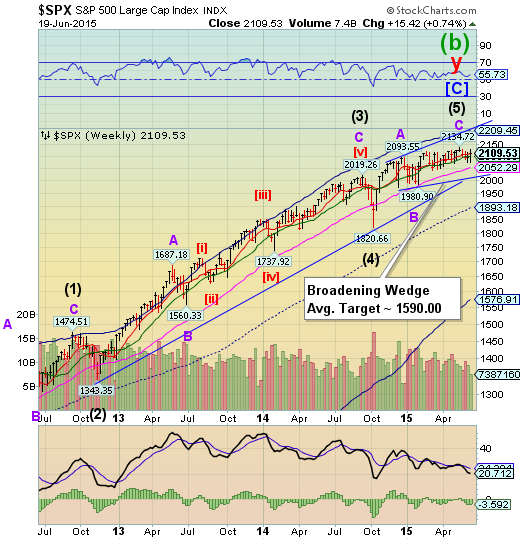
SPX closed beneath weekly Short-term support at 2110.53, despite a massive effort to make a new high. This leaves SPX on a sell signal and vulnerable to a drop to or below the next (Long-term) support level at 2052.29 and the double trendlines near 2025.00 (also round number support at 2000.00).
(ZeroHedge) Yesterday, during an interview on MSNBC, presidential candidate Donald Trump said he has some big names in mind for the Treasury secretary if he wins the White House. "I'd like guys like Jack Welch. I like guys like Henry Kravis. I'd love to bring my friend Carl Icahn." He also opined on the economy and the stock market, admitting that the Fed has benefited people like him, but that the economy is in a "big fat economic and financial bubble like you've never seen before."
NDX closes at the Ending Diagonal trendline.
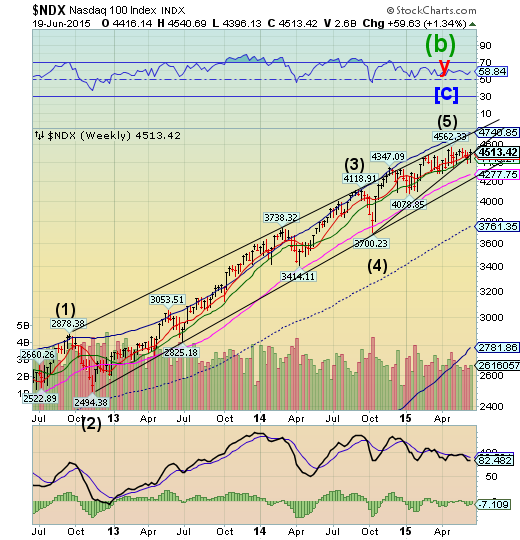
NDX closed near its Ending Diagonal trendline at 4500.00 this week. The loss of the trendline puts NDX on a sell signal. This implies a complete retracement to its October 15 low at 3700.23.
High Yield Bonds close beneath all nearby support.
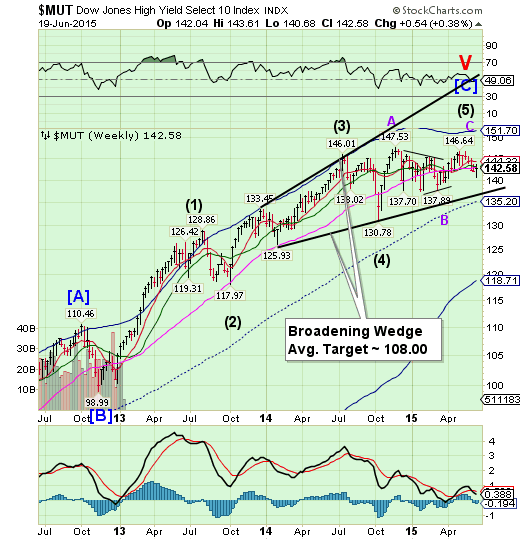
The High Yield Index has lost all Model supports and appears destined for the lower trendline of its Broadening Wedge formation. It is also due for a major low by early July. The financing of stock buybacks is being seriously threatened.
(ZeroHedge) There is hardly a better signal that inflection points in asset classes have been reached than major shifts in capital in/outflows. As a reminder, Bank of America (NYSE:BAC) has practically made a career of dragging out the old "great rotation" canard every time there has been a, well, great rotation, out of bonds and into stocks for the past 4 years... only to always top (and bottom) tick said capital flows.
Overnight, it did it again, when it reported that based on EPFR data, bond funds just suffered the biggest weekly outflow in 2 years, when some $10.3 billion left bonds matched by a nearly identical $10.8 billion inflow into stock funds: the largest since March.
The euro extend edits retracement.
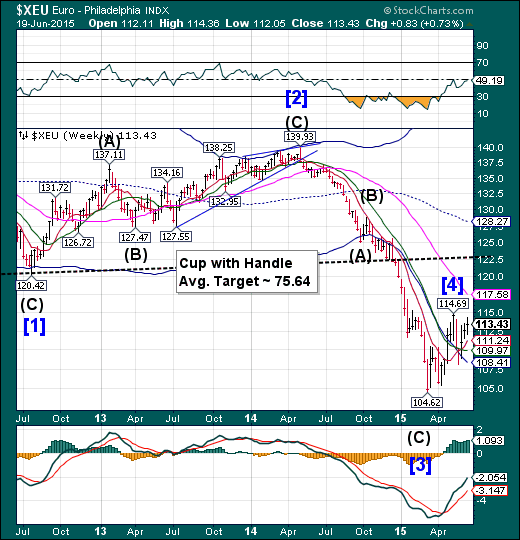
The euro completed a 95% retracement of its recent decline on Thursday. This is primarily a result of weakness in the dollar rather than any strength in the euro. We may now see the euro resume its decline through early July.
(Economist) It is never pleasant to watch a relationship founder. Greece’s prime minister, Alexis Tsipras, has charged its creditors with trying to humiliate the country; he has accused the IMF of “criminal responsibility” for Greece’s suffering. Prominent euro-zone politicians are saying openly that, without a deal to release rescue funds in the next few days, default and “Grexit” loom.
(ZeroHedge) One week ago, we were stunned to learn just how low the political organization that is the mostly US-taxpayer funded IMF has stooped when, a day after its negotiators demonstratively stormed out of the Greek negotiations with "creditors," Hermes' ambassador-at-large Christine Lagarde said that the IMF "could lend to Ukraine even if Ukraine determines it cannot service its debt."
Euro Stoxx bounce off weekly Long-term support.
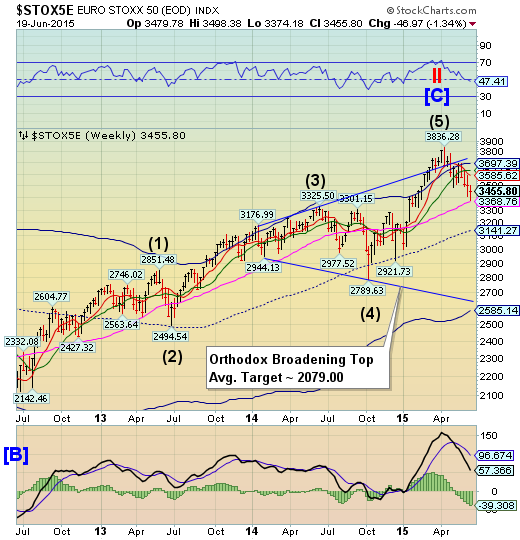
EuroStoxx 50 bounced from its Long-term support at 3368.76. It is on a sell signal that may last through the month of June. A panic decline may ensue as STOXX declines beneath this support.
(ZeroHedge) Europe's VIX has never been higher relative to the US' VIX... ever.
Europe's VIX is now trading 2.2 times that of US' VIX...
The yen resumes its rally from its Cycle Bottom.
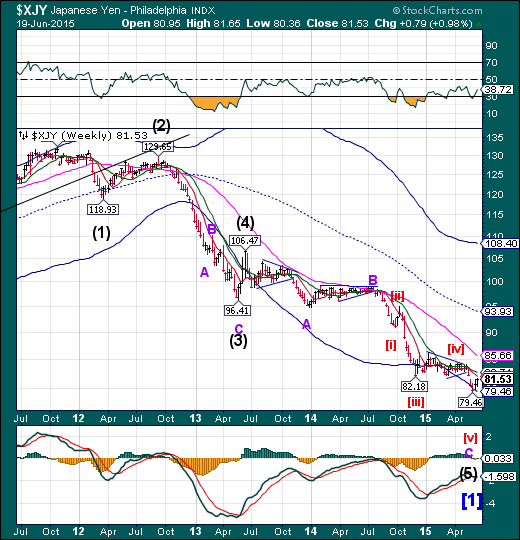
The yen resumed its rally from its Cycle Bottom support this week, approaching Short-term resistance at 82.15. The Cycle low came on June 5. The initial rally may last through early July, according to the Model.
(Reuters) - Bank of Japan Governor Haruhiko Kuroda said the yen's current weakness was not inflicting severe pain on the economy, toning down an earlier warning to markets against pushing the currency too far down.
He also shrugged off the view held by some market players that the central bank could be dissuaded from expanding its monetary stimulus further because of downside to a weak yen, like the pain households feel from rising import prices.
"At present, I don't think yen declines are causing severe damage to Japan's economy," Kuroda told reporters on Friday.
The Nikkei weakens.
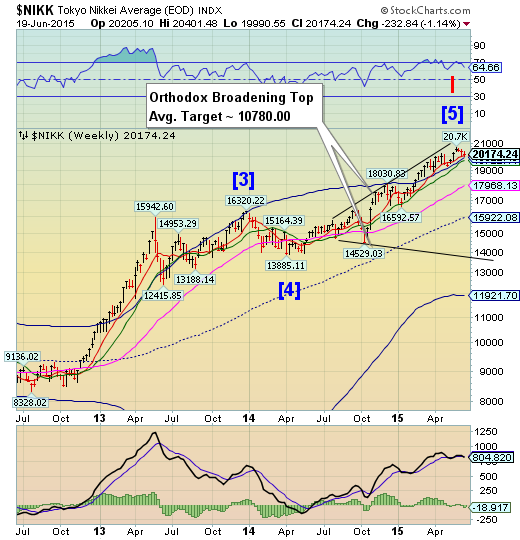
The Nikkei weakened, but has not violated Short-term support at 20059.28. There are three supports within close proximity of one another. A loss of Intermediate-term support at 19722.11 may confirm a change in trend.
(Reuters) Japan's Nikkei share average rebounded from a one-month low on Friday as buyers took advantage of recent dips, but trade was cautious ahead of a Bank Of Japan policy decision and its governor's comments after the meeting.
The Nikkei share average rose 0.7 percent to 20,131.95 points by mid-morning, after dipping below the 20,000-mark for the first time since mid-May.
At the two-day meeting ending on Friday, the BOJ is expected to maintain its massive asset buying programme and pledge to increase base money at an annual pace of 80 trillion yen ($650 billion).
U.S. dollar extends its retracement.
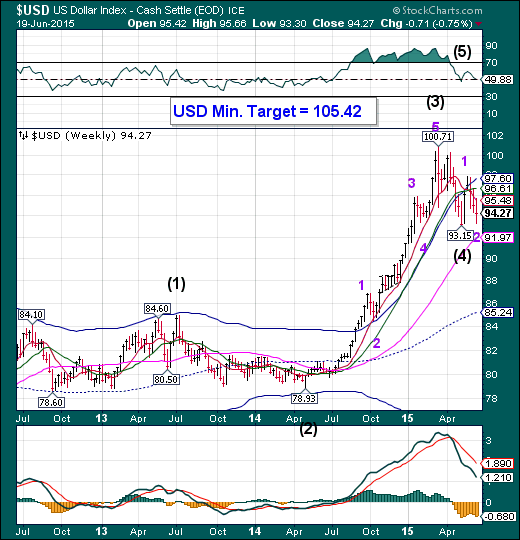
The US dollar extended the retracement through Thursday of this week, as suggested last week. The decline is ended and next probe higher is likely to break out above its Cycle Top resistance at 97.60. The Cycles are now positive through mid-July.
(WSJ) The dollar fell against the euro and the yen this week, as investors pushed back their expectations for higher U.S. borrowing costs and played down risks associated with the debt crisis in Greece.
But major currencies remain in tight ranges due to the increased uncertainty over the Federal Reserve’s timeline for raising interest rates and over the negotiations between Greece and its creditors in Europe.
USB rallied above Long-term support/resistance.
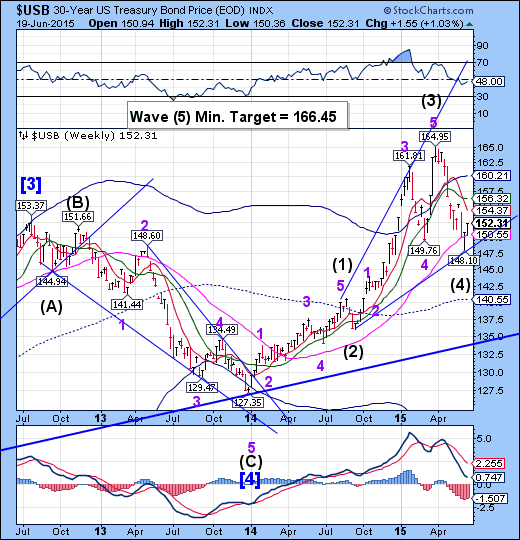
The Long Bond rallied above weekly Long-term support at 150.55. The Cycles Model now suggests a period of strength that may propel USB higher through the end of June. The minimum target for this rally appears to be 166.45 later this summer. USB may go higher in this Broadening Wedge formation, but is being challenged by a nearly 34-year-long overhead trendline near 166.00 (not shown).
(WSJ) U.S. Treasury bonds rallied Friday and capped the biggest one-week price gain in three months, as worries over Greece’s debt crisis stoked demand for haven assets.
“There is a sense of unease in the markets as the clock continues to tick down to the approaching deadline for Greece to strike a deal to avoid a debt default,” said Millan Mulraine, deputy head of U.S. research and strategy at TD Securities in New York.
The bond market is stabilizing after a weeks-long selloff driven by signs of improving economic outlook in the U.S. and eurozone and valuations concerns.
Gold fails to overcome Long-term resistance.
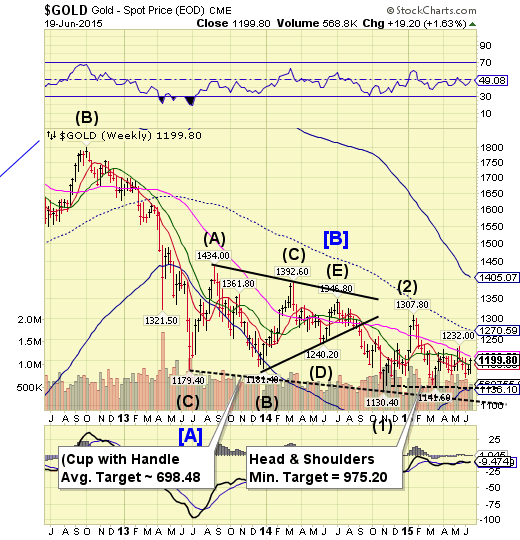
Gold retested its weekly Long-term resistance at 1209.50 this week, but fell short at a high of 1205.70 on Thursday. A probable decline beneath 1141.60 may develop, which may trigger the Head & Shoulders formation with a minimum target of 975.20. The Cycles Model now suggests a substantial low in late June to early July.
(CNBC) Gold is enjoying its third straight day of gains on Friday, and is up some $20 since Tuesday's settlement.
The moves comes after the Federal Reserve remained committed to maintaining an ultralow federal funds rate target in its Wednesday statement, sending the dollar lower on the week, alongside short-term yields.
Higher short-term rates are often seen as the mortal enemy of gold, for a few distinct reasons. First, gold bars throw off no yield (conversely, they are costly to store), so they become an increasingly inferior means of preserving wealth the higher that risk-free rates rise. Second, rising short-term rates are positive for the dollar, as it makes holding the greenback a more attractive proposition. And a stronger currency means that it takes fewer of those dollars to buy the same amount of gold.
The crude rally may have run out of time.
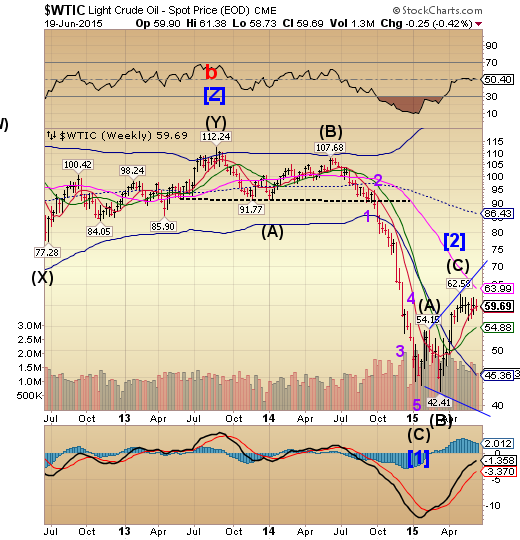
Crude appears to have run out of time for a probe toward its weekly Long-term resistance at 63.99. It is now time to be prepared for a massive decline into mid-July once Short-term support at 59.43 is decisively broken.
NYMEX-traded WTI (West Texas Intermediate) crude oil futures contracts for July delivery rose by 0.88% and settled at $60.45 per barrel on June 18, 2015. Prices rallied due to the appreciating US dollar and declining crude oil inventories. The US benchmark following ETFs like the United States Oil Fund LP (NYSE:USO) and the ProShares Ultra DJ-UBS Crude Oil (ARCA:UCO) mirrored crude oil prices and rose in Thursday’s trade. They rose by 0.74% and 1.41%, respectively, on June 18, 2015.
Shanghai Index reversed beneath weekly Short-term support/resistance.
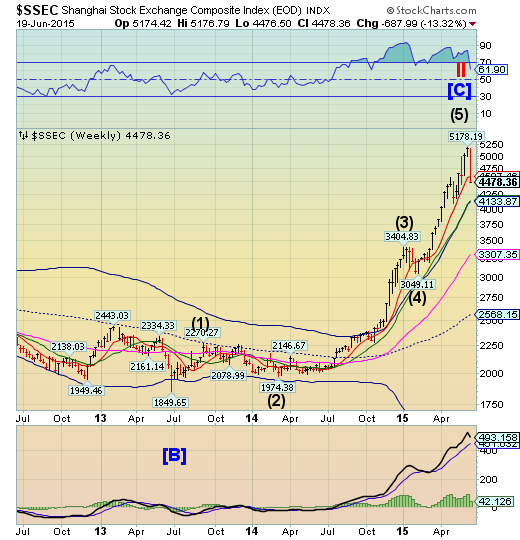
The Shanghai Index finally reversed down last Monday, as suggested in last week’s report, which concluded, “the Cycles Model suggests a probable reversal next week.” It appears that the current weakness may extend through mid-July. The first probable target appears to be weekly Intermediate-term support and Cycle Top at 4133.87.
(ZeroHedge) For the 2nd time in a month, China's Shanghai Composite entered a correction, plunging 10% from local highs, as headlines of delayed IPOs and large-scale steel 'dumping' at a loss combined with global monetary policy fireworks and European event risks. The rest of the more highly sensitive and manic Chinese equity markets are also plunging with CHINEXT and CSI-300 down over 7% in the last month (and 17% from the highs in the case of the former).
Before you read on - STOP and look at the volatility we are talking about here... multiple 10 to 15% swings in major stock indices in the last month. Compare that to the US market's idiocy, where we have seen no vol whatsoever in the last six months.
The Banking Index in a “throw-over” phase.
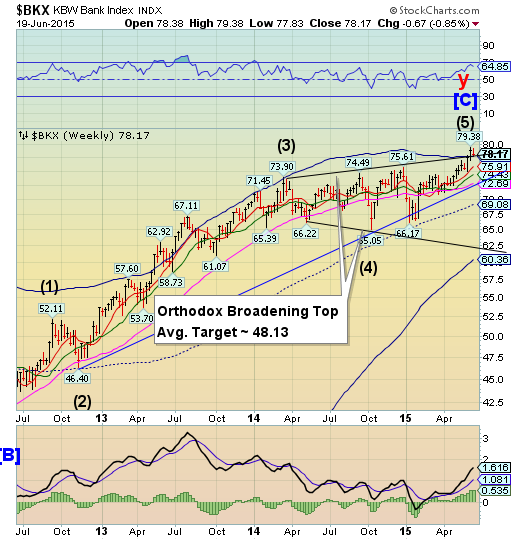
--BKX is still in a throw-over phase, resting above Cycle Top support/resistance and Megaphone trendline at 77.79. The reversal must exceed weekly Short-term support at 75.91 to change to a sell signal. The Cycles Model now implies that BKX may decline through the end of June.
(ZeroHedge) Yesterday evening, after what had been a dramatic surge in the Greek bank run, which has resulted in over €3 billion in cash withdrawn through Thursday night, the Greek central bank requested an emergency cash dispensation from the ECB under the country's Emergency Liquidity Assistance program, just one day after the ECB granted the latest €1.1 billion expansion in the ELA. Earlier today, in an unscheduled session, the ECB did as requested; however, it granted Greece far less than the amount it sought, and according to MarketNews reports, the ECB gave Greece just €1.8 billion in addition funds.
This means that Greek deposits have declined by over €5 billion in the past 7 days alone, as indicated by the surge in the ELA from €80.7 billion on June 10 to €85.9 billion currently.
Worse, as Reuters reported, on Friday alone there was another €1.2 billion in deposit outflows, which means that the entire ELA increase has already been used up, and Greece is again facing the abyss.
(ZeroHedge) Update: what else - an official denial: EU OFFICIAL: ECB DIDN'T SAY GREEK BANKS MAY NOT OPEN MONDAY
So, Benoit did not say what he said?
Just minutes after Greek FinMin Varoufakis warned people were trying to "incite capital flight" from Greece, and Dijsselbloem stated that "capital outflows from Greece are worrying," Reuters is reporting that The ECB dropped the bank run hammer:
ECB TOLD EURO ZONE FINANCE MINISTERS IT WAS NOT SURE IF GREEK BANKS WOULD BE ABLE TO OPEN ON MONDAY- OFFICIALS
Friday sees Russia-Greece meetings, and Euro area leaders are supposedly meeting on Monday evening due to the seriousness of the situation, so it appears the endgame is looming large one way or another.
