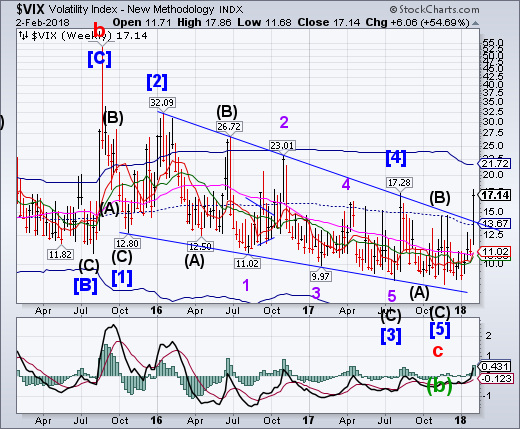
VIX vaulted through the upper trendline of its 2-year Ending Diagonal formation, which puts it on a confirmed buy signal. A breakout above the Ending Diagonal trendline suggests a complete retracement of the decline from January 2016, and possibly to the August 2015 high.
There's "buying-the-dip"... and then there's this (ZeroHedge)!!!
After a couple of days of volatility in stocks, prices falling and VIX rising, 'investors' - if that's what one calls them - have decided to pile back into one ETF in a size that is utterly unprecedented.
They’ve poured a record $520 million into an exchange-traded note that gains when VIX drops...
SPX signals the rally may be over.
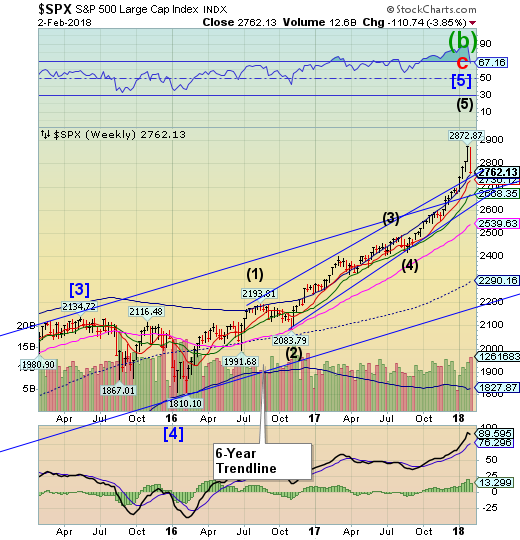
SPX began on Monday retracing its parabolic rally, declining to its Cycle Top and upper Diagonal trendline at 2762.45. This action suggests the rally may be over and profits should be taken. A break of the Intermediate-term support at 2668.35, and the trendline nearby, generates a sell signal. Should that happen, we may see a sharp decline in the next week or more.
US stocks fell sharply on Friday after a stronger-than-expected jobs report sent interest rates higher (CNBC).
The Dow Jones Industrial Average dropped 665.75 points to close at 25,520.96, capping off the index's sixth-largest points decline ever. The 30-stock index also fell below 26,000. Friday also marked the first time since June 2016 that the Dow fell at least 500 points.
The S&P 500 fell 2.1 percent and finished at 2,762.13, with energy as the worst-performing sector. The Nasdaq composite plunged 1.96 percent to 7,240.95 as a decline in Apple (NASDAQ:AAPL) and Alphabet (NASDAQ:GOOGL) offset a strong gain in Amazon (NASDAQ:AMZN) shares.
NDX declines beneath its Channel trendline.
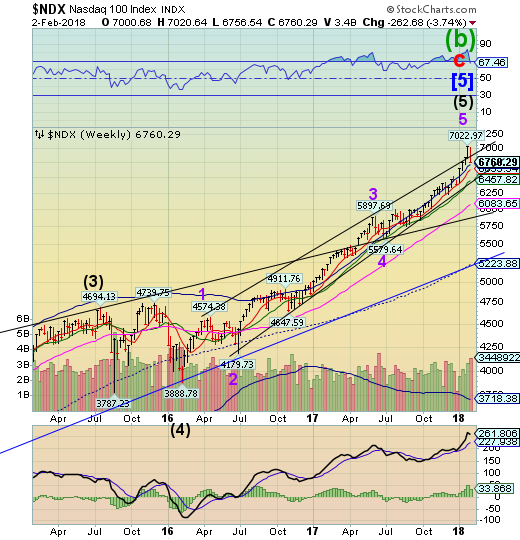
The NDX declined beneath the trendline at 6890.00 suggesting that the rally may be over. A further decline beneath lower Diagonal trendlineand Intermediate-term support at 6457.82 may produce a sell signal.
With positioning at extremes, and leverage at extremes, and valuations at extremes, Deutsche Bank's Binky Chadha raises the red flag as the correlation across asset-classes soars to record highs signaling extreme contagion risk (ZeroHedge).
Very strong momentum across asset classes has seen Crude Oil up, the dollar down, equities and bond yields up, with the average correlation between them rising to 90%.
As Chadah concludes, whatever the fundamental case for each of the asset-class trades, extended positioning argues at a minimum for a breather and more likely a pullback soon.
Moreover, the tight correlation in the moves across the major asset classes (oil up, dollar down, equities and bond yields up) suggests a pullback in one for idiosyncratic reasons would likely spill over to the others.
Dow Jones High Yield Select 10 slides down to its Cycle Top.
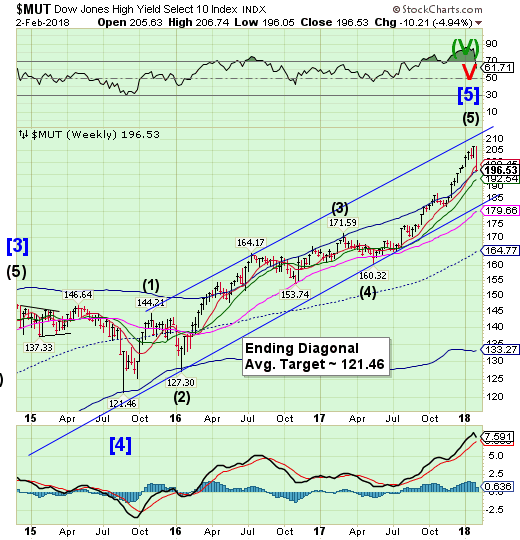
The High Yield Bond Index slid down to challenge its Cycle Top support at 196.27.In the process it declined beneath its Short-term support at 198.45.The Uptrend and a sell signal may result from a decline beneath its Cycle Top or Intermediate-term support at 192.54. Monday’s open may tell the whole story.
That high-yield bonds have decoupled from stocks (despite both their valuation-bases being driven from underlying business volatility) is not a new factor in the melt-up manic-manipulated markets we experience every day (ZeroHedge).
But, as DoubleLine's Jeffrey Gundlach notes, the size of the divergence is becoming extreme to say the least.
"JNK chart looks like death. No way to win here, folks..."
UST breaks down beneath the Cycle Bottom Support.
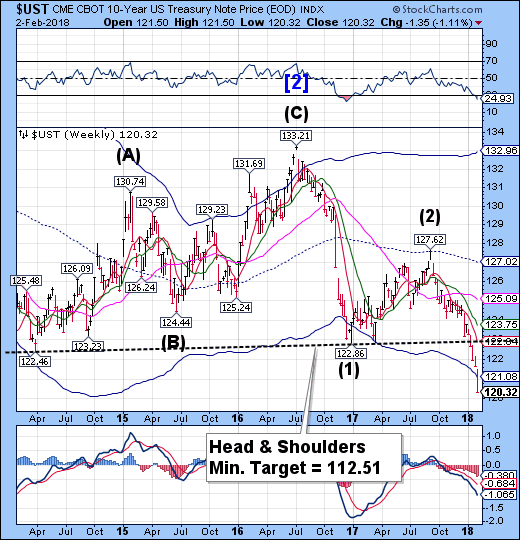
The 10-Year Treasury Note Index plunged through its Cycle Bottom support, leaving no visible support at hand. A Master Cycle low may have been made last week, but is only seen as a hesitation in the decline. If so, UST may not see another bounce until late February.
The 10-year Treasury yield jumped to a four-year high after a better-than-expected jobs report reflected rising wages (CNBC) . Yields also got a boost from higher-than-expected consumer confidence numbers as investors began to bet on accelerating inflation from this growing economy.
The US Labor Department reported Friday that the US economy added 200,000 jobs in January, topping economist expectations of 180,000 jobs added. Average hourly earnings posted a 0.3 percent gain for the month and an annualized gain of 2.9 percent, the best gain since the early days of the recovery in 2009.
The euro had an “inside week.”
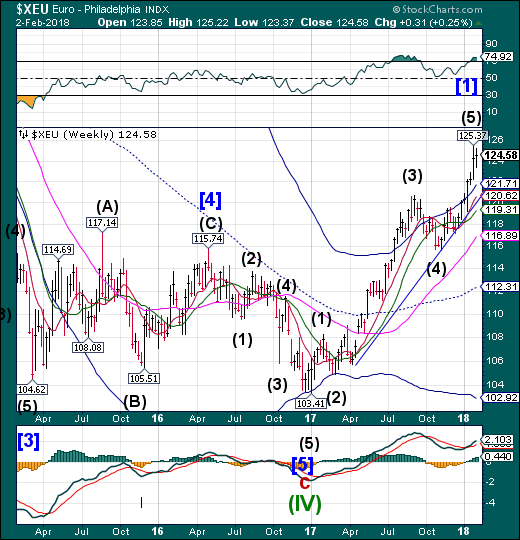
The euro had an “inside week” after turning down last Friday. That can either be the “pause that refreshes,” or an early warning of a reversal. A decline beneath the Cycle Top at 121.71 suggests the rally may be over. A sell signal lies at the trendline and Intermediate-term support at 120.62.
The euro neared multi-year peaks on Friday as talk of policy tightening in Europe and expectations that inflation is set to gear higher drove up borrowing costs globally (Yahoo).
Yields on 10-year US Treasurys jumped to a near four-year peak, markedly steepening the curve and squeezing out investors who had feverishly bet on a tighter spread between longer-dated and short-dated yields.
Global central banks have recently struck a more hawkish tone with impressive economic data and buoyant oil prices driving up long-term inflation expectations.
Euro Stoxx 50 break all supports.
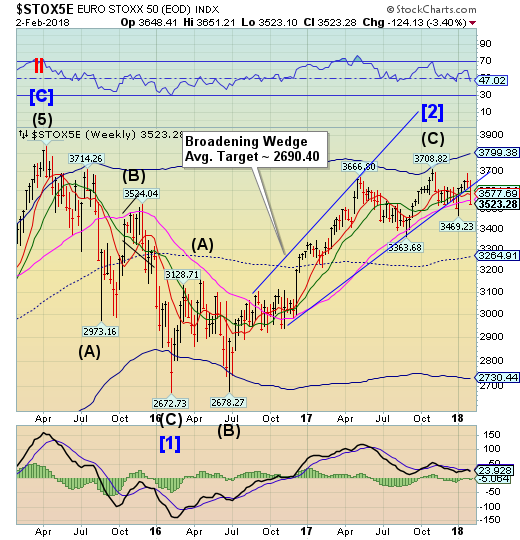
The Euro Stoxx 50 Index broke down through all support, including Long-term support at 3547.05. That action puts Stoxx on a confirmed sell signal.
European equities closed lower on Friday afternoon as investors digested further earnings reports (CNBC).
The pan-European Stoxx 600 closed Friday provisionally 1.38 percent lower with every sector trading in negative territory. The index recorded its biggest weekly loss since November 2016 mainly driven by banking stocks and higher yields.
Deutsche Bank AG (DE:DBKGn) (NYSE:DB) reported a net loss of about 497 million euros for 2017 — its third annual consecutive loss. The stock fell more than 11 percent over the week. Caixabank SA (MC:CABK) also fell heavily after reporting its latest numbers. The Spanish bank reported a quarterly net profit that was down by 70 percent from the third quarter.
The yen falls back to mid-Cycle support.
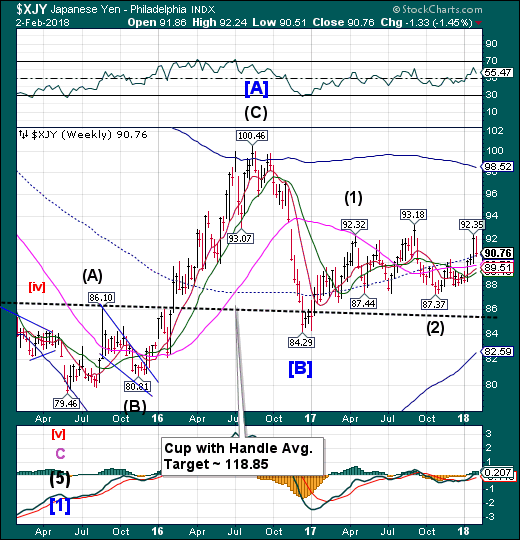
The Yen fell back to mid-Cycle support/resistance at 90.56 in a retest of support. The Cycles Model suggests another surge of strength for another week, possibly longer.
A double-barreled blast of bond buying by the Bank of Japan did little to weaken the yen on Friday, as the test of wills continues between the central bank and the investors who suspect it is readying to retreat on massive monetary easing (Nikkei Asian Review).
Market watchers were surprised by the timing of Friday's fixed-rate purchasing operation, in which the BOJ names a yield and offers to buy an unlimited amount of Japanese government debt at that level. Since its introduction in 2016, this has been regarded as the bank's ultimate weapon for keeping the Japan 10-Year at its target of around zero.
Nikkei declines to Cycle Top.
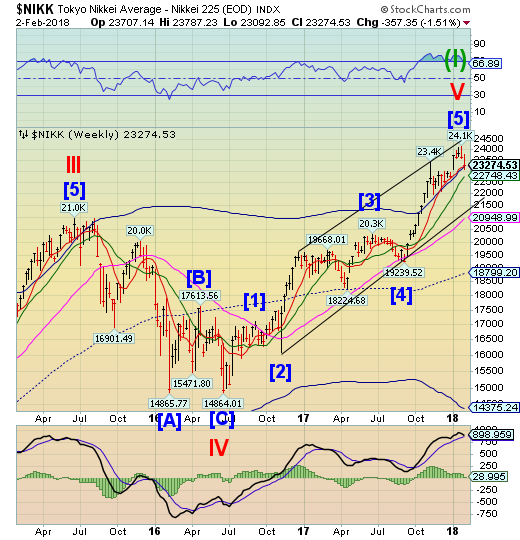
The Nikke declined to close beneath Short-term support at 23334.98, but above its Cycle Top at 23223.16. The rally may be over, producing an aggressive sell signal beneath the Cycle Top. Confirmation comes at the crossing of the lower Diagonal trendline near 21500.00.
Japan's Nikkei share average fell on Friday on weakness in most sectors, with banking stocks down on worries that domestic bond yields would be kept low after the central bank conducted a special bond purchase operation to curb rising yields (BusinessLine).
Kyocera Corporation (NYSE:KYO) tumbled 6.6 per cent and was the biggest negative contributor to the Nikkei after it cut its annual net profit outlook.
The Nikkei dropped 0.9 per cent to 23,274.53. For the week, it dropped 1.5 per cent. The broader Topix shed 0.3 per cent to 1,864.20, with 26 of its 33 sectors falling.
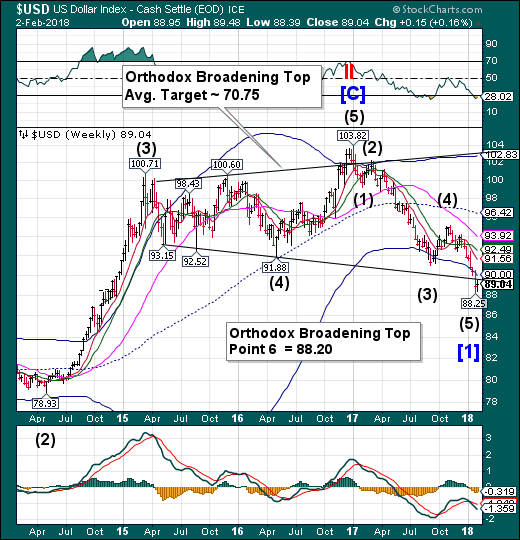
USD consolidated without reaching its “Point 6” target at 88.20. The fact is, the Cycles Model calls for a probable continuation of the decline to the week of February 5 with a likely overshoot of its goal. Having said that,reaching the target may be reason enough to take downside profits. As Sir John Templeton once said, “I like leaving a little on the table for the next guy.”
The greenback slid further Thursday after the Trump administration was seen as stepping back from the strong dollar policy that has been in place since the 1990s (CNBC).
The dollar index was slightly lower, after falling sharply Wednesday on the initial comments from Treasury Secretary Steven Mnuchin that a weak dollar was good for US trade. But when given the opportunity to clarify his comments at the World Economic Forum early Thursday, Mnuchin did not latch on to the strong US. dollar rhetoric used by past Treasury secretaries.
Gold has an inside week.
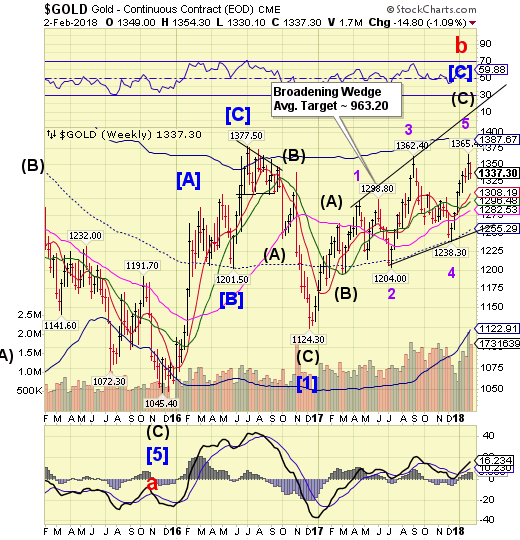
Gold consolidated under last week’s close, but did not make a new low. Gold is still very extended and may not give a tradable signal until it declined beneath Short-term support at 1308.19. However this action suggests the end of a trend,
Gold may be heading for the biggest weekly loss since December, but bulls are keeping the faith, confident that the dollar’s biggest advance in more than a year won’t last (Bloomberg).
The greenback jumped as much as 1 percent after stronger-than-expected US jobs data bolstered the case for the Federal Reserve to raise interest rates. Gold dropped after the report. While higher rates dampen the appeal of non-interest bearing bullion, Tai Wong, the New York-based head of base and precious metals trading at BMO Capital Markets, is skeptical the greenback’s gains will hold.
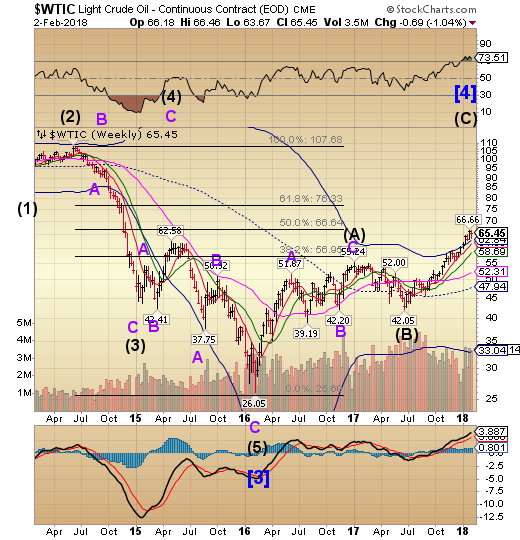
Crude Oil consolidates beneath resistance.
