VIX challenged weekly Intermediate-term resistance at 11.96 on Tuesday, then pulled back beneath Short-term support at 11.44 to complete a retracement. An aggressive buy signal may be forthcoming should the VIX rally back above its Intermediate-term resistance. The breakout above its consolidation area may produce a slingshot move.
(BusinessInsider) The Federal Reserve said January 22 it is worried about the "low level of implied volatility in equity markets"
- The VIX, a gauge of market fearfulness, has been bouncing around at historic lows
- That seems at odds with the "considerable uncertainty" the Fed expects in U.S. policy
The Federal Reserve is worried that the stock market might be showing signs of complacency.
SPX reverses at all-time high.
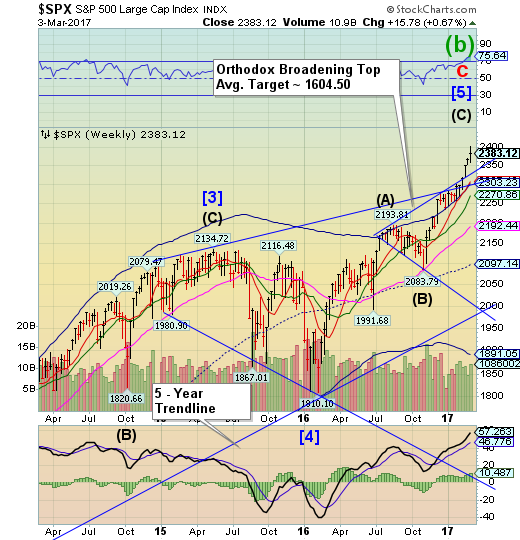
SPX rallied through Wednesday, making a new all-time high. A reversal of a throw-over may be a strong indication of a change in trend. A decline beneath the Cycle Top supportand Short-term support, both near 2303.00, gives the SPX a sell signal. A break of those supports may send the SPX to its cycle Bottom at 1891.05, or possibly lower.
(RealInvestmentAdvice) I have a simple question:
If the rally in the market that began following the election was pricing in the expectations for tax reforms, repatriation, building the wall, and infrastructure spending, then what did the rally on Wednesday following Trump’s speech to Congress price in?
With the markets now pushing both a 3-standard deviation extension above the 50-dma AND an almost 9% deviation above the 200-dma, there is little argument of the overbought condition that currently exists.
NDX stumbles.
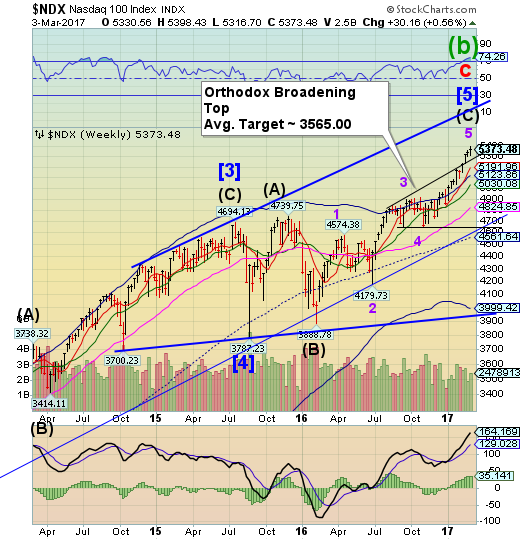
NDX made its all-time high on Wednesday and reversed down on Thursday. NDX is still extended, so a breakdown may not register until it declines beneath Short-term support at 5191.95. However, the Cycles Model suggests weakness through mid-March.
(ZeroHedge) In yet another awkwardly rational response to government intervention in deciding what's "fair", the blowback from minimum wage demanding fast food workers has struck again. Wendy's plans to install self-ordering kiosks in 1,000 of its stores - 16% of its locations nationwide.
"Last year was tough — 5 percent wage inflation," said Bob Wright, Wendy's chief operating officer, during his presentation to investors and analysts last week. He added that the company expects wages to rise 4 percent in 2017. "But the real question is what are we doing about it?"
Wright noted that over the past two years, Wendy's has figured out how to eliminate 31 hours of labor per week from its restaurants and is now working to use technology, such as kiosks, to increase efficiency.
High Yield Bond Index slips beneath Cycle Top resistance.
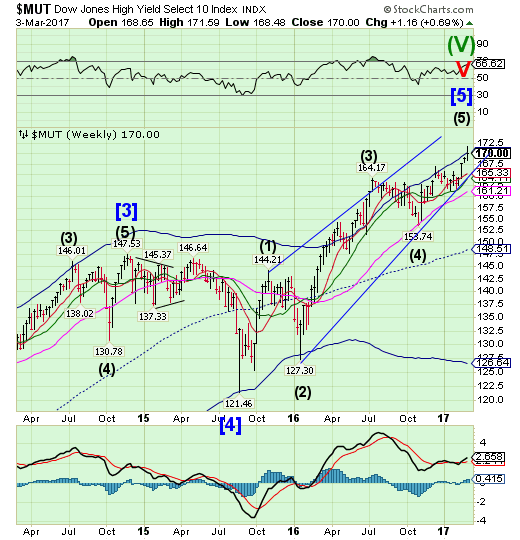
The High Yield Bond Index also made its high on Wednesday, but slipped beneath its Cycle Top resistance at 170.37 the following day. A break beneath the Diagonal trendline and Short-term support at 165.33 implies a complete retracement of the rally may occur. The Cycles Model suggests weakness ahead.
Your parents probably taught you some basic life lessons. Look both ways before you cross the street. Cover your mouth when you cough. Don't buy high-yield debt securities when the yield spread between them and Treasuries is too low.
Just as the stock market's price-to-earnings ratio can be a warning sign, so can the yield spread on junk bonds. And right now, that sign is flashing red.
Junk bonds — or high-yield bonds, the Wall Street name for them when the public is listening — get those high yields because they are issued by companies with suspect credit ratings. The high yields you get are the reward for the possibility, however remote, that the issuer will default and you'll have to stand in line with other creditors in bankruptcy court.
USB still consolidating.
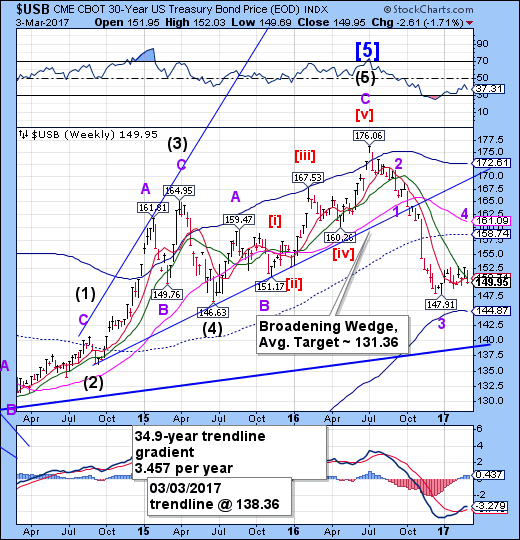
The Long Bond declined beneath Intermediate-term resistance at 150.68, prolonging its consolidation. The Cycles Model now suggests that a period of strength may develop through mid-March. The mid-Cycle resistance at 158.74 still appears to be the target.
U.S. Treasurys fell Thursday as Federal Reserve officials prepped the market for a March rate hike.
In a CNBC interview Thursday, Federal Reserve Gov. Jerome Powell said economic conditions, such as U.S. inflation and the employment level, are reaching the central bank's ideal state.
Powell said:
You put that all together and I think the case for a rate increase for March has come together and I think it's on the table for discussion.
The euro is being squeezed between support and resistance.
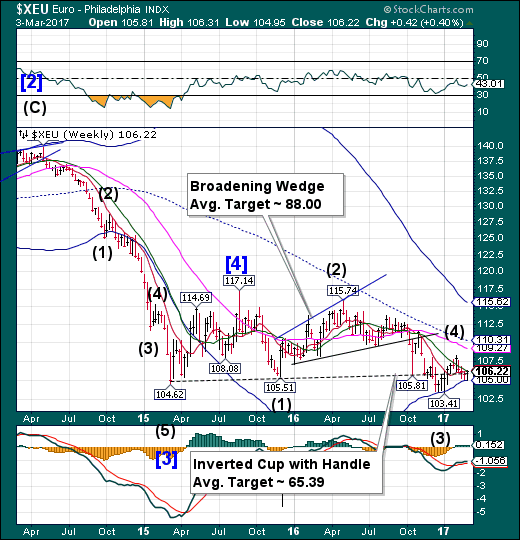
The euro bounced from its Weekly Cycle bottom at 105.00 on Wednesday, challenging Intermediate-term resistance at 106.19.A bounce to Long-term resistance at 109.41 may be the next outcome. There may be some Cyclical strength in the next two weeks.
Twenty-five years ago, when plans for the euro were formally set down, an unofficial promise was made: Bring this currency to life, and the economies that use it will grow together.
That hasn’t happened. And now, as the region’s growth solidifies, the process of “convergence” -- an aligning of economic outcomes -- may yet be thrown further back when the stimulus being supplied by the European Central Bank eventually stops.
“The euro area’s travails are largely due to lack of effective convergence, both before the financial crisis and since then,” the ECB’s Benoit Coeure said last month in a speech in Maastricht, where the treaty creating the single currency was signed in 1992.
Euro Stoxx makes a new retracement high.
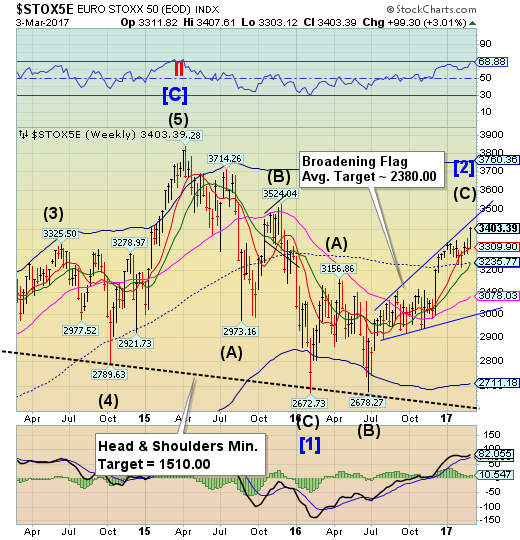
The EuroStoxx 50 Index made a new retracement high this week. The period of strength has been extended, but the rally may be coming to a hard stop. A break of short-term support at 3309.90 may offer a sell signal which may be confirmed beneath mid-Cycle support at 3235.77.
European stocks closed little changed, paring earlier losses, as banks rallied and French shares climbed after polls showed anti-euro candidate Marine Le Pen lagging rival Emmanuel Macron for the first time.
The Stoxx Europe 600 Index dropped 0.1 percent at the close, after earlier sliding as much as 0.5 percent. France’s CAC 40 Index climbed 0.6 percent to close at its highest level since August 2015.
Investors are also awaiting a speech by Federal Reserve Chair Janet Yellen after European markets close, following hawkish comments by her colleagues earlier this week that boosted bets for a March rate hike. Banks have been the biggest beneficiaries of that speculation, leading gains among industry groups and helping send the Stoxx 600 to its best weekly advance this year.
The yen breaks through Intermediate-term resistance.
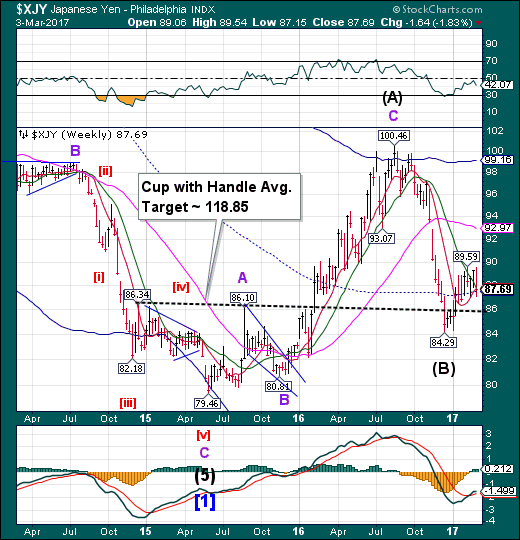
The yen broke out above its prior high, then pulled back to close above mid-Cycle support at 87.52. A breakout may be considered a strong buy signal, but it would need to rise above the congestion zone to confirm it. The Cycles Model suggests a period of strength may last through mid-March.
Buy the pound. Don’t short the yen. Take profits on the ruble.
These are some of the views of Credit Suisse (SIX:CSGN) Group AG’s senior adviser, Robert Parker, who spoke in a phone interview from London this week. He joined the bank in 1982 and was previously vice chairman of its asset-management business.
Parker said the biggest moves in currencies are mostly over as elections in Europe and a likely retreat in global stock markets will make investors cautious about putting money into riskier investments
The Nikkei makes a new retracement high.
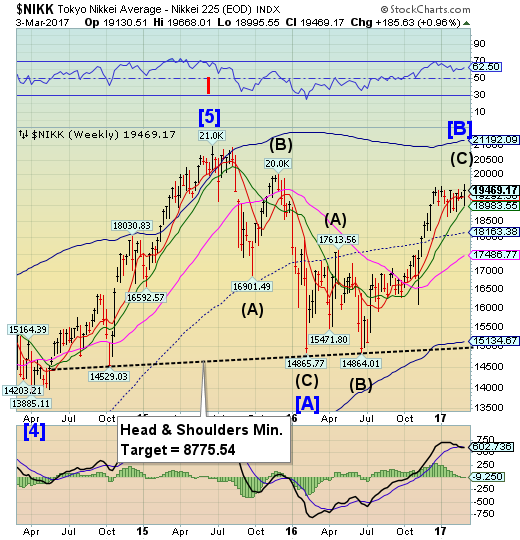
The Nikkei broke out of a consolidation pattern to make a new high this week. A breakdown beneath this consolidation zone and Intermediate-term support at 18983.55 confirms a sell signal. A loss of the next supports suggests a potential decline to the Cycle Bottom at 15134.67 or lower.
The Nikkei index retreated on Friday as a correction on Wall Street encouraged some limited selling while dollar momentum also faded with caution ahead of Fed Chair Yellen’s comments later on Friday.
Wall Street equities were subjected to profit taking on Thursday with the S&P 500 index declining 0.59% on the day after strong gains the previous day and the U.S. correction had some negative impact on Japanese equities.
U.S. dollar challenges the Bro
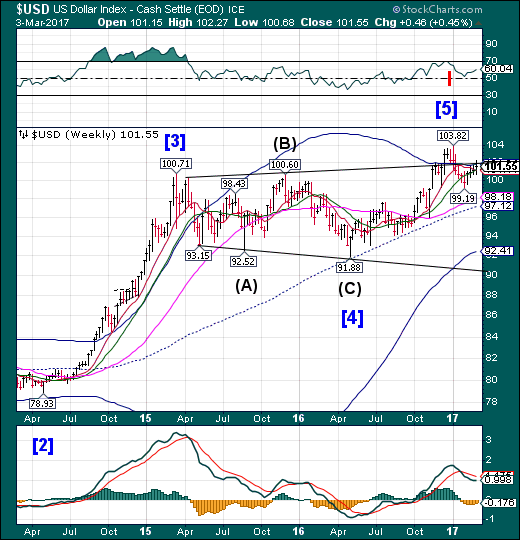
USD challenged the upper trendline of its Broadening Top near 102.00, closing beneath it. It closed above Short-term support at 101.11 after challenging it as well.A sell signal is activated beneath Short-term support. The ensuing decline maybe described in superlatives.
Wall Street stock indexes and the U.S. dollar both posted gains for the week on Friday after Federal Reserve Chair Janet Yellen confirmed market expectations for an interest rate rise in March but profit taking saw equities and the greenback slip for the day.
After regional Fed officials during the week mostly signaled the likelihood of a second policy rate rise in the past three months, in a speech on Friday Yellen confirmed the view that rates may rise at the next Fed meeting on March 14-15 barring any sharp deterioration in economic conditions.
The implied probability of a March rate hike surged to almost 80 percent from 77.5 percent the previous day, according to CME Group's (NASDAQ:CME) FedWatch tool.
Gold gives up prior week’s gains.
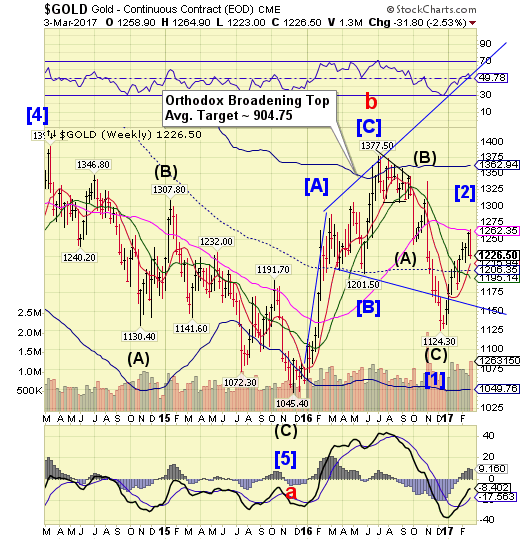
Gold challenged Long-term resistance on Monday, then gave up the entire gain from the previous week. The Cycles Model tagged the reversal within a day and now suggests the decline may resume in earnest. The Orthodox Broadening Top pattern now appears to anticipate a final decline to its target illustrated on the chart.
Gold investors are waking up to the reality of an increasing probability that borrowing costs in the U.S. could rise this month.
Bullion futures fell for a second day as the odds that the Federal Reserve will boost interest rates this month jumped to 80 percent on Wednesday, from 52 percent a day earlier and 34 percent last week, according to Fed fund futures data compiled by Bloomberg. Higher rates curb the investment appeal of non-interest bearing gold, while boosting the dollar.
Gold, which rallied more than 8 percent this year, has been thrown into reverse amid a rapid rethink by investors as Fed officials signaled more willingness to consider a rate hike this month. The Fed’s preferred measure of consumer prices climbed 1.9 percent from a year earlier, just shy of its 2 percent target that was last met in April 2012, according to a government report on Wednesday.
Crude may break down from its consolidation.
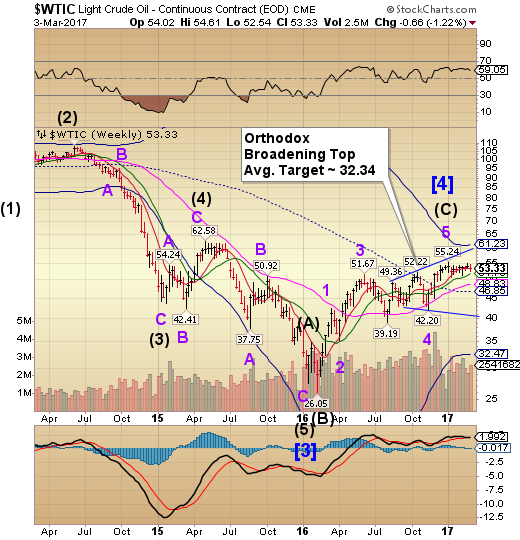
After a two-month sideways consolidation, Crude appears to have broken beneath its short-term support at 53.50.A decline beneath Intermediate-term support at51.78 produces a sell signal for crude. The Cycles Model suggests a significant low may occur by mid-March.
Uncertainty continues as OPEC output and rising US rig-count would be the driving force for oil in 2017. Ever since the Organization of Petroleum Exporting Countries sealed an internal deal as well as one with a major non-OPEC, Russia, to cut production from 1st January to June 2017 to support falling prices, WTI prices have been steadily rising. In fact, from the date of the Vienna meet, 29th November 2016, oil has risen 23%. The bulls and bears are now fighting near $55 to get a grip on oil. The confusing thing is that, since January 2017, oil is trading within a tight range of $50 and $54.
OPEC claims 86% of deal compliance has been achieved till 22nd February. There is no news of any OPEC member ditching the deal. On the other hand, the US rig-count is increasing due to rising WTI prices. This is something the market expected. Rising WTI prices render US shale-oil drilling financially viable, and every week the EIA’s report shows the rig-count rising (see chart below). The US rig-count (shown by the white line) has gone up since May 2016 to 602 on 24th February.
Shanghai Index turns down.
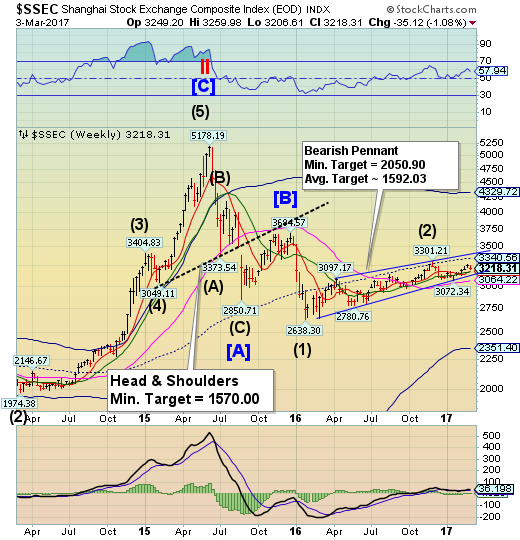
The Shanghai Index appears to have ended its bounce last week without making a new high.The fractal Model suggests the Shanghai is due for another 1,000 point drop. The index restores its sell signal beneath Intermediate-term support and trendline at 3164.50.
With China actively engaged in trimming overcapacity among some of its legacy industries, a familiar and troubling problem has re-emerged, one we discussed extensively in late 2015 and early 2016 - China needs to find a way to transplant unnecessary workers in legacy, "dirty" industries to new jobs in new sectors. Overnight we got a reminder of just this dilemma faced by Beijing, when China's labor minister said on Wednesday China needs to reallocate half a million steel and coal workers in 2017 due to capacity cuts in these industries as the world's second-largest economy tries to combat excess in the bloated industries.
"This year we will continue to cut capacity in coal and steel," Yin Weimin, the head of China's Ministry of Human Resources and Social Security, told reporters. "We will need to reallocate jobs to 500,000 workers," he said, including assigning workers different jobs within the same or a different company, early retirement or encouraging them to become entrepreneurs.
The Banking Index peaked on Wednesday.
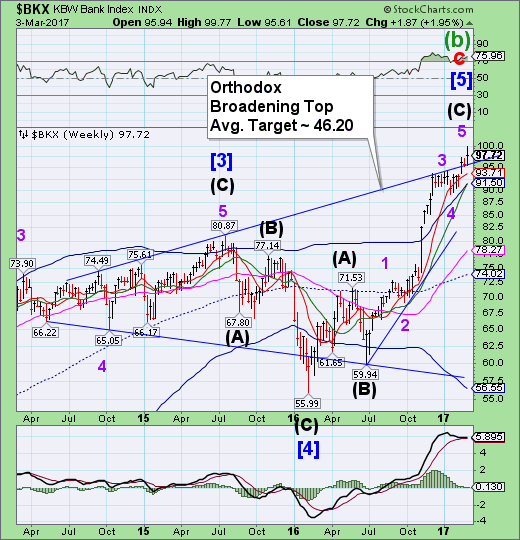
BKX made an all-time high on Wednesday, then pulled back.The brief probe higher that was called for was accomplished. BKX appears to be ready for a large decline that may extend through mid-March, according to the Cycles Model.
Banks have raked in nearly $1 trillion in profits since the financial crisis, but they paid a steep price along the way.
In total, financial institutions have paid $321 billion in fines related to the crisis, according to a study released this week by the Boston Consulting Group. U.S. banks have shouldered most of those costs, though global institutions also have been hit.
The release comes the same week the FDIC reported that bank profits surged to a record $171.3 billion in 2016, boosted by a best-ever $45.6 billion in the third quarter. The year's proceeds brought the total post-crisis net (measured from the third quarter of 2009) to $987.8 billion, according to FDIC records.
The four "too big to fail" money center banks Bank of America (NYSE:BAC) , Citigroup (NYSE:C) , JP Morgan (NYSE:JPM) and Wells Fargo (NYSE:WFC) have had bull market gains since the election and set post-election highs as March began.
The FDIC Quarterly Banking Profile for the fourth quarter suggests that these stocks may have rallied too far, too fast. The Federal Deposit Insurance Corporation shows that progress of healing from the "Great Credit Crunch" stalled as 2016 ended.
Fourth-quarter FDIC data shows a decline in Quarterly Net Income to $43.7 billion, down from $45.6 billion in the third quarter. For all of 2016, net income rose by 7.7%, to $171.3 billion. This is important as the four big banks control 41.9% of the total assets in the banking system.
Following unconfirmed sources earlier warning about a major capital raise for the world's most systemically dangerous bank, Bloomberg reports that Deutsche Bank AG (DE:DBKGn) is nearing a plan to boost capital by more than 10 billion euros ($10.6 billion) through an equity offering and the partial sale of its asset management unit, according to people with knowledge of the discussions.
The measures, which executives may review as soon as this weekend, would be a way for the bank to boost capital buffers instead of by selling its Postbank unit, said the people, who asked not to be identified because the plans haven’t been announced. Deutsche Bank is now leaning toward reintegrating the consumer banking business, the people said.
