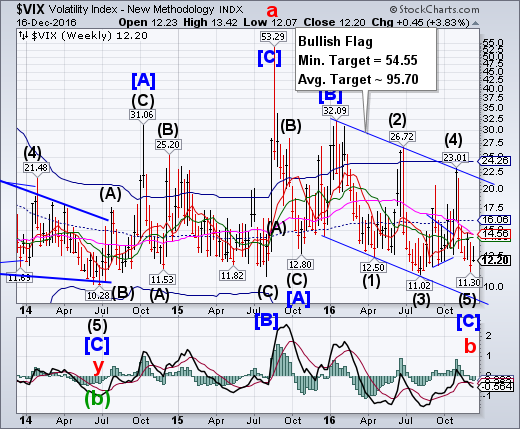
VIX had an inside week, not able to break out, but closing higher than last week. It appears to have made a Master Cycle low on December 8. Should it break out, it may rally to its Cycle Top at 24.26, if not higher.The implications are enormous, since a breakout above the Bullish Flag implies higher targets to come.
(ZeroHedge) The last two weeks have seen some 'odd' behavior in the relationship between equity protection (VIX) and equity price markets.
And as Brean Capital's Peter Tchir notes, this is possibly the strangest chart I’ve done (and that is a reasonably high hurdle) but I think there is something to it.
VIX remains a fear indicator, though now it seems to send the best signals when it is measuring the Fear Of Missing Out.
SPX challenges the double Broadening trendlines, closes beneath them.
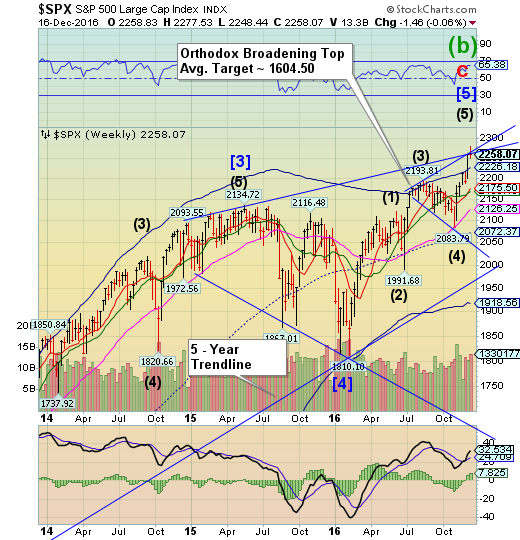
SPX peaked above the upper trendlines of two Orthodox Broadening Tops near 2272.00-2273.00 on Tuesday before slipping beneath both trendlines on Wednesday. This double reversal suggests the rally may be over.The smaller Broadening Top has a possible average target of 1604.50. It appears that point 5 of the Orthodox Broadening Top may be complete.
(Bloomberg) What began as a record-setting streak for U.S. stocks fizzled as the week progressed, with the Dow Jones Industrial Average approaching and ultimately falling short of 20,000, as the biggest driver of the post-election rally declined.
Financial firms decreased for the first time since Donald Trump’s presidential victory, ending a five-week advance in which the group propelled benchmark indexes to records. The S&P 500 Index lost 0.1 percent to end at 2,258.07, while the Dow average climbed within 0.45 percent of 20,000 before ending at 19,843.41, a gain of 0.4 percent for the five days.
The NDX completes the terminal rally in an Orthodox Broadening Top.
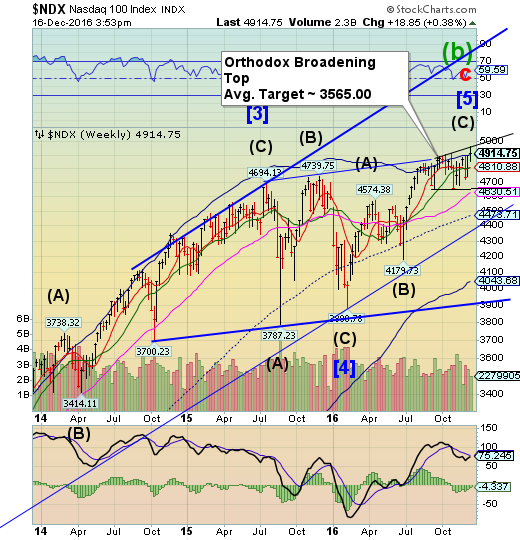
NDX challenged the upper trendline of an Orthodox Broadening Top on Tuesday.It has since pulled back, closing above its Cycle Top support at 4903.75. A breakdown beneath the Cycle top produces a sell signal while a further break of the lower trendline at 4650.00 confirms a further decline to the Broadening Top target.
(Chicago Tribune) Falling technology and financial stocks pulled U.S. indexes back from the edge of record highs on Friday. Bond yields gave up some of their big gains from the last few days, and the dollar downshifted from its sharp climb against other currencies.
The Standard & Poor's 500 index fell 3.96 points, or 0.2 percent, to 2,258.07. It had wobbled up and down through the day, never rising by more than 0.3 percent or falling by more than 0.3 percent.
The Dow Jones industrial average fell 8.83 points, or less than 0.1 percent, to 19,843.41. The Nasdaq composite fell 19.69, or 0.4 percent, to 5,437.16 after climbing above its record closing level earlier in the day. All three indexes remain within 1 percent of their record highs.
High Yield Bond Index makes a final high, reverses.
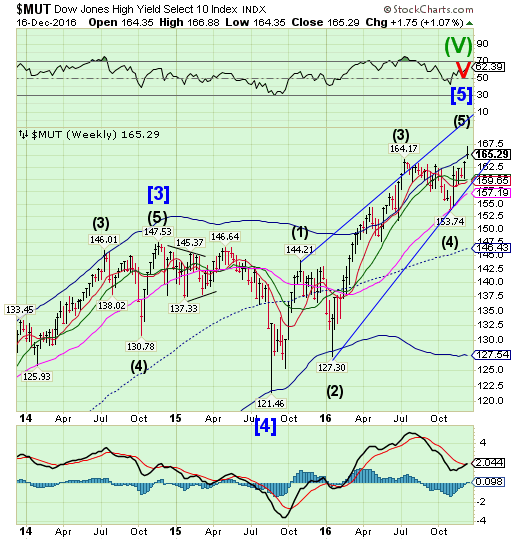
The High Yield Bond Index rallied through its Cycle Top resistance at 165.33 before pulling back beneath it at the close.The reversal finally arrived on Tuesday.A reversal back beneath the Cycle Top constitutes an aggressive sell signal. That signal is confirmed by declining beneath its Short-term support at 159.65.A failure at Long-term support at 157.19 may produce a sharp decline to mid-Cycle support at 146.43.
USB resumes its decline.
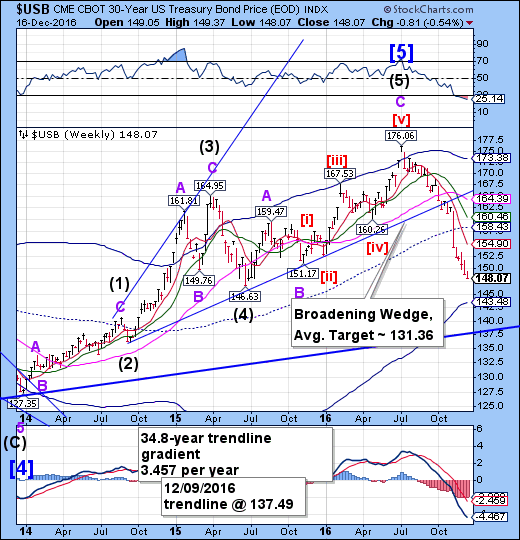
The Long Bond hardly bounced this week before resuming its decline.The period of strength has passed with nary a nod.While there is a chance of a bounce next week, the overall direction appears to be down until early January. The probable target appears to be its 35-year trendline at 137.50.
(ZeroHedge) One month ago, when we last looked at the Fed's update of Treasuries held in custody, we noted something troubling: the number had continued to drop sharply, declining by another $14 billion in one week, and pushing the total amount of custodial paper to $2.788 trillion, the lowest since 2012. One month later, we refresh this chart and find that in last week's update, there is finally some good news: foreign central banks finally bought some US paper held in the Fed's custody account, which following months of liquidation, rose over the past two weeks by $23 billion, the biggest two-week advance since November of 2016, pushing the total amount of custodial paper to $2.816 trillion, the highest since early October.
The Euro breaks the trendline.
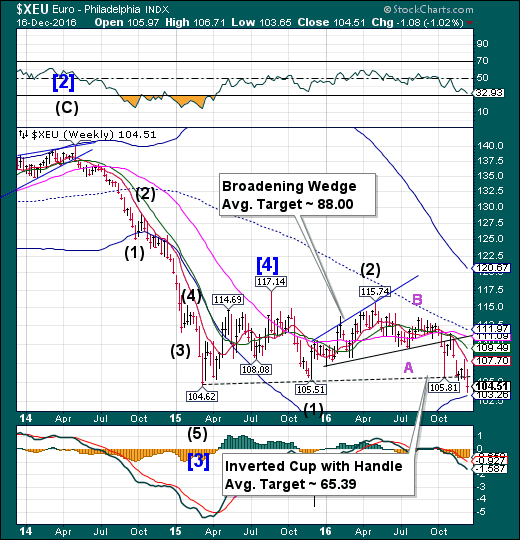
The Euro broke through the Lip of its inverted Cup with Handle formation again this week after a month-long consolidation above it. This is the weakest performance against the Dollar since January 2003. It may bounce at its Cycle Bottom at 103.26 or possibly at parity sometime next week or two.Since the Broadening Wedge trendline has already been broken we may see its target coming into view by mid-February.
(CNBC) Divergence in monetary policy between the United States and Europe will bring parity between the value of the euro and dollar, according to ING Group.
On Thursday the euro hit a low of 1.0364 against the dollar, the lowest level since August 2003 when it traded as low as 1.0357.
Dollar strength is the key driver as investors believe the Federal Reserve will adopt a higher rate rise path in 2017 as the U.S. economy gathers momentum.
Conversely, the European Central Bank (ECB) has just announced it will inject a further 540 billion euros of QE (quantitative easing) stimulus in to the stuttering EU economy.
Euro Stoxx 50 exceeds mid-Cycle resistance.
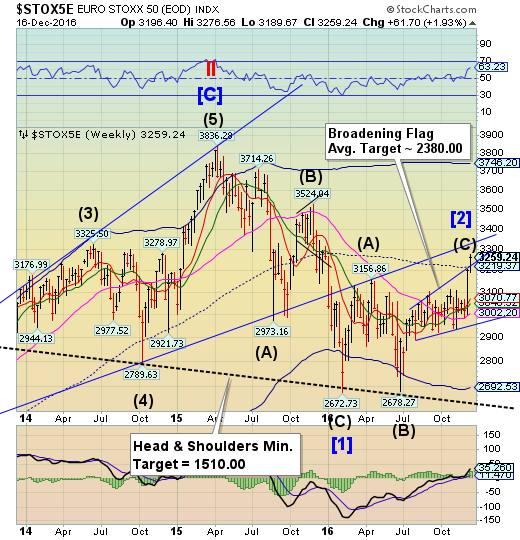
The EuroStoxx 50 Index has exceeded its Broadening Flag trendline and mid-Cycle resistance at 3219.37.An overshoot that is less than 3% above its trendline is not critical provided the move is retraced in short order. The Index must complete a reversal pattern beneath mid-Cycle support/resistance before a sell signal may be issued.
(Barrons) The outlook for European equities is surprisingly bright going into 2017, given the political clouds gathering around the euro zone and the broader European Union.
With at least three general elections in the offing amid surging support for anti-establishment parties and the United Kingdom’s slowly unfolding Brexit drama, investors might be expected to head for the hills. They shouldn’t.
The Stoxx Europe 600 index is widely forecast to fare better next year than its 1% loss so far in 2016. More telling is its performance over the past three months, when it has risen 4.7%, fueled by improving economic indicators. While most economists currently expect the euro zone’s gross domestic product to loiter around the 1.4% annualized growth rate it notched in the third quarter, investors have been buoyed recently by better-than-expected data, including encouraging purchasing managers’ activity and retail sales figures. Consensus forecasts put the Stoxx index at around 381 at the end of 2017, a gain of 5.8% from the current level.
The Yen extends its retracement beneath the trendlines.
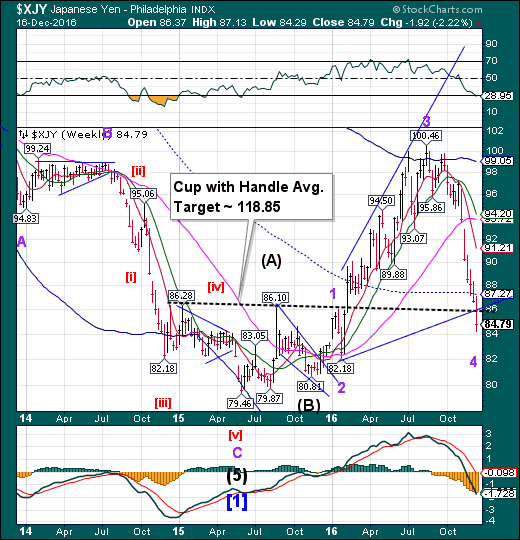
The Yen extended its decline approximately 2.1% beneath its trendlines. The rule in an overshot is that a 3% move beyond negates the trendline or formation. In addition, the Yen made a probable Master Cycle low on Thursday.There may be a week of cyclical strength ahead.The decline sets up a probable “slingshot” move, launching the Yen toward its Cup with Handle target.
There’s not much talk about the Yen in the press these days.
The Nikkei 225 rallies to new retracement highs.
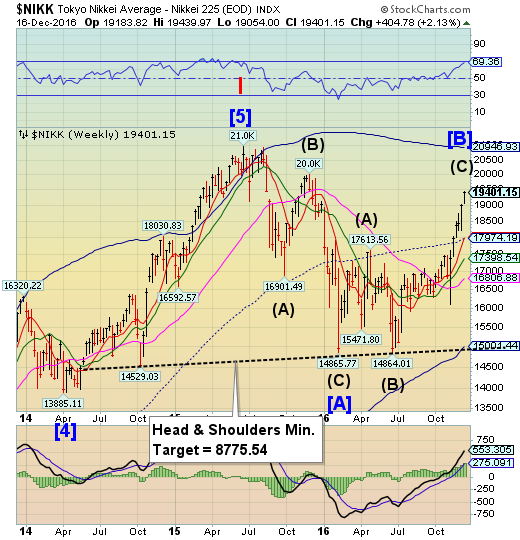
The Nikkei has completed approximately a 72% retracement of the decline from its June 2015 high.The period of cyclical strength may have ended and may lead to a two-week decline to its Cycle Bottom at 114934.81. Should the Head & Shoulders neckline be broken, a panic may ensue.
(Investing) Japan stocks were higher after the close on Thursday, as gains in the Power, Finance & Investment and Shipbuilding sectors led shares higher.
At the close in Tokyo, the Nikkei 225 gained 1.45% to hit a new 6-months high.
The best performers of the session on the Nikkei 225 were Tokyo Electric Power Co., Inc. (T:9501)., Inc.(T:9501), which rose 17.78% or 81.0 points to trade at 536.5 at the close. Meanwhile, Mitsubishi Motors Corp. (T:7211). (T:7211) added 6.38% or 37.0 points to end at 616.5 and Fujitsu Ltd. (T:6702) was up 6.18% or 41.6 points to 714.8 in late trade.
U.S. Dollar rose above the trendline.
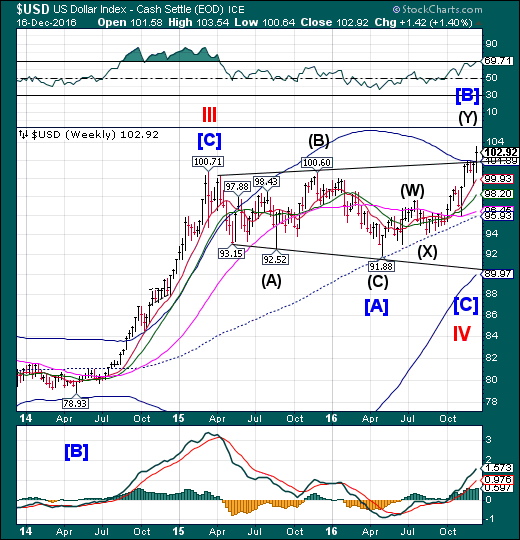
USD broke above the upper trendline and the Cycle Top at 101.89 this week in what may be its terminal move. A break of the dual supports may give USD an aggressive sell signal. A further decline beneath Short-term support at 99.93 may change the outlook from bullish to bearish as traders find themselves wrong-footed.
(Reuters)The U.S. dollar edged lower against a basket of major currencies on Friday, but still held near 14-year highs touched after Wednesday's Federal Reserve meeting, with profit-taking halting the greenback's rally.
The dollar index .DXY, which measures the greenback against a basket of six major rivals, was last at 102.900, not far from Thursday's 14-year high of 103.560 but down 0.12 percent on the day.
The index gained 1.2 percent on Thursday to mark its biggest daily percentage gain in nearly six months a day after the U.S. central bank raised interest rates for the first time in a year. The Fed also signaled it was likely to hike rates three more times in 2017, up from the two increases forecast at the central bank's September meeting.
Gold undershot its target.

Gold undershot its Orthodox Broadening Top short-term target of 1150.00 on Thursday, setting up a retracement bounce that may challenge its Long-term resistance at 1273.87. The Cycles Model suggests a probable three-week rally that matches with the Broadening Top pattern which calls for a retracement of one-third to one-half of the decline.There is a risk that the rally may undershoot its target.
(CNBC) Gold has plunged over 11 percent in the weeks since the U.S. election, and some say the losses will accelerate.
After briefly rising above $1,375 per troy ounce in early July, gold has given back nearly all of its gains on the year. At its Thursday lows of $1,124, gold was just 5.6 percentage points — $64 — away from wiping out all its gains on the year.
If gold does finish 2016 in the red, it would mark the fourth-straight year in which the metal has logged a loss. The last time it saw such a streak 1988 to 1992.
Crude makes a new terminal high.
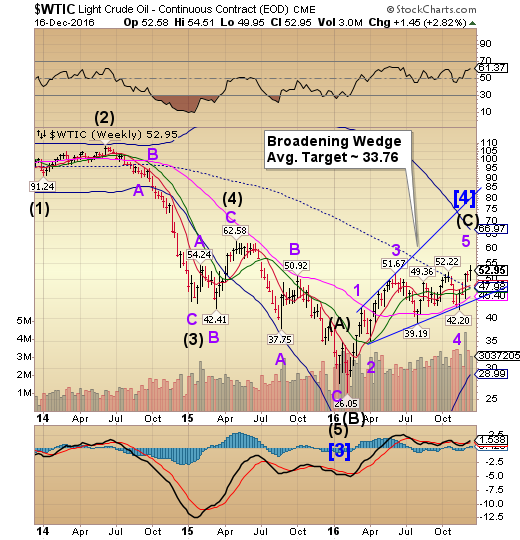
Crude remained above its mid-Cycle support, allowing it to make a new retracement high at 54.51. Since then it completed a reversal pattern (daily charts) and may decline to challenge the lower trendline of its Broadening Wedge.The Cycles are compressed here, making sudden moves highly probable.
(Investing.com) - Oil futures finished higher on Friday, turning positive for the week amid indications that major crude producers are adhering to their promise to pull back on output.
On the ICE Futures Exchange in London, Brent oil for February delivery jumped $1.19, or 2.2%, to settle at $55.21 a barrel by close of trade Friday, not far from a 17-month high of $57.89 touched earlier in the week.
London-traded Brent futures logged a gain of 88 cents, or 1.6%, on the week.
Elsewhere, on the New York Mercantile Exchange, crude oil for delivery in February tacked on 98 cents, or 1.9%, to end the week at $52.95 a barrel, within sight of a one-and-a-half-year peak of $54.51 logged on December 12.
Shanghai Index declines to its Bearish Flag trendline.
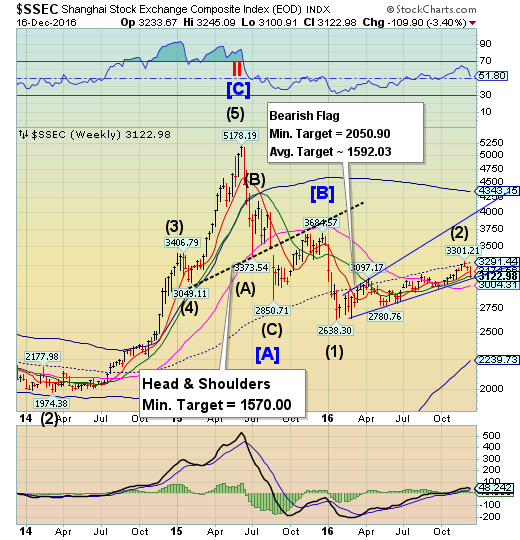
The Shanghai Index declined to the lower trendline of its Bearish Flag formation at 3100.00 before challenging Intermediate-term resistance at 3117.70.Acontinued decline may lead to a breakdown beneath the Broadening Wedge trendline.The fractal Model suggests the Shanghai is due for another 1,000 point drop, possibly starting next week. The next significant low may be due in about one week.
(ZeroHedge) One day after China's regulator halted trading in bond futures for the first time ever, Beijing suffered another catalytic bond-market event overnight when it failed to sell all the Treasury Bills on auction Friday, for the first time in almost 18 months, as bids fell short of minimum requirements, according to traders required to bid at the auction.
(Bloomberg) It’s turning out to be a really bad week for Chinese financial markets.
The benchmark stock index has tumbled 3.6 percent, poised for its worst week since April. The yuan depreciated to its lowest level against the dollar since June 2008, while government bonds plunged, with the 10-year yield surging by a record 22 basis points on Thursday.
While some of the losses can be attributed to the Federal Reserve’s prediction of three interest-rate hikes next year, China has its own sources of stress. Surging money-market rates sparked by government deleveraging efforts are curbing demand for everything from equities to debt at the same time as capital outflows accelerate. The selloff will probably deepen over the next month, CCB International Securities Ltd. says.
The Banking Index consolidates above the trendline of its Broadening Top.
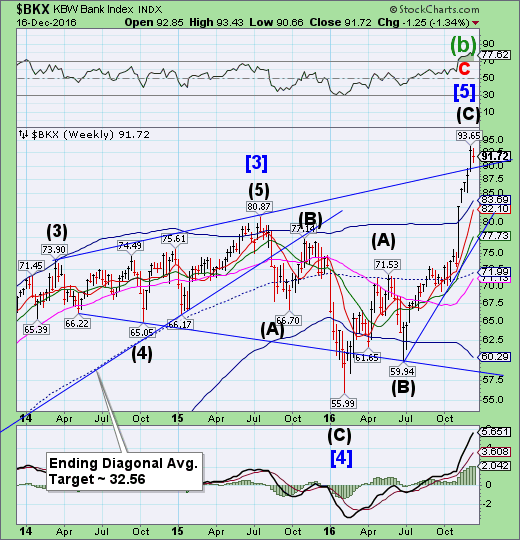
BKX surged above the upper trendline of its Orthodox Broadening Top at 90.00 this week.A reversal beneath the trendline at 90.0 may result in a further decline to the mid-Cycle support at 71.99. The ultimate target may be the “point 6” target near 54.00. Once broken, we may expect this three-year Broadening Top pattern to unwind very quickly.
(ZeroHedge) Yesterday, in an amusing interlude, Deutsche Bank (DE:DBKGn)'s TorstenSlok "explained" how stocks would react to any particular wording of the Fed rate hike.
Musing somewhat cynically, we said "this time is different", or maybe it's just 1929 all over again, because according to Deutsche Bank, after 8 years of easing sent the S&P to all time highs, the only thing that is more bullish than a dovish Fed, is a Hawkish one, and as a result no matter what the Fed does tomorrow, and how it hikes rates, equities can only go "higher."
(ZeroHedge) Mortgage applications have fallen almost non-stop since their exuberant peak the week of July 4th, tumbling to 2016 lows to the same dismal level of activity as was witnessed after Lehman in Oct 2008. The reason is simple, as we detailed previously, the spike in mortgage rates has slashed the population of refinanceable borrowers from 8.3 million immediately prior to the election to less than 4 million, matching a 24-month low set back in July 2015.
With mortgages surging above 4.00%, mortgage applications have collapsed - equalling the dismal lows set during the Lehman debacle in Oct 2008...
(ZeroHedge) In a last ditch attempt to avoid a state bailout, on Monday Italy's Monte Paschi will begin a share sale process as it aims to complete a capital raise of €5 billion ($5.2 billion) before Christmas, Bloomberg reported overnight. The bank will canvass institutional investor interest through Thursday, while the offer for retail investors will end on Wednesday. As the lender didn’t provide terms of the offer, the price and total number of shares to be sold will be determined based on investor demand and on the outcome of the separate debt-to-equity swap which started last week.
(WSJ) Last week, Credit Suisse (SIX:CSGN) Group AG’s Chief Executive TidjaneThiam stood up to deliver what seemed like bad news: the Swiss lender would miss some profit targets and cut yet more costs.
The bank’s shares soared 7%.
After being pounded for months, Europe’s beleaguered banking sector is back in vogue. Spurred by the prospect of looser regulations and higher interest rates, investors are piling back into the sector. Returns for the Stoxx Europe 600 Banks index turned positive for the year to date Thursday, a huge reversal for a sector that spent the year as one of the region’s worst performers.
Go figure.
