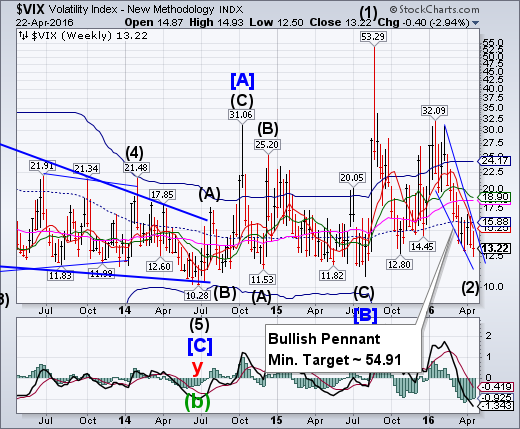
VIX appears to have completed its long-awaited Wave (2) at 12.50 on Wednesday. A buy signal (NYSE sell signal) may result from a subsequent rally above its Pennant trendline at 14.50, while closing above mid-Cycle resistance at 15.88 may confirm the signal.
(ZeroHedge) Who’s afraid of the big bad bear? No one, it seems.
The CBOE VIX Index sits at 13, just 8% higher than its one year low from last July. In our monthly look at the “VIX of” everything from tech stocks to gold and high yield bonds, we can see why. It is the most interest rate-sensitive industry groups – Utilities, Consumer Staples and Telecomm – that show similar levels of implied volatility in their listed options (what the VIX actually measures). At the other end of the spectrum are Energy, Financials and Consumer Discretionary names. These groups are still 25-98% away from their one year lows in terms
SPX has another near miss.
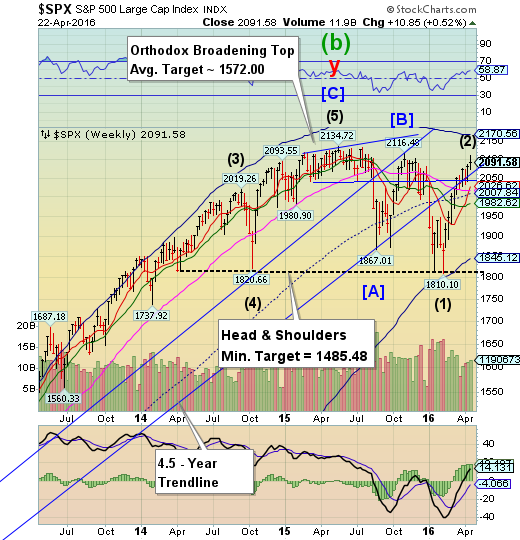
The SPX peaked this week at 2111.05 on Wednesday, missing the November 3 high of 2116.48. The rally took 69 days from its February 11 low to it April 20 high. This is comparable to the 63 day rally from the March 17 low to the May 19 high in 2008. A reversal beneath the 4.5-year trendline near 2075.00 may constitute a sell signal on the SPX. Trendlines are important support areas that often attract, then repel the markets. Earnings season is in high gear this week and next week.
(WSJ) U.S. stocks finished Friday’s session essentially flat, but spent most of the day in the red, as the market finally got around to noticing it’s earnings season. Or, rather, the market finally got around to noticing that earnings season isn’t going well.
Shares of both Microsoft (NASDAQ:MSFT) and Alphabet Inc. (NASDAQ:GOOG) fell on Friday, dragging down the tech sector and putting a collar on the market overall. The two companies reported after the bell on Thursday. The numbers and outlooks were disappointments compared to Street expectations. The sector fell nearly 2% on Tuesday, singlehandedly pulling the Nasdaq into the red, and keeping the Dow and S&P very close to it.
NDX could not close its gap in a second attempt.
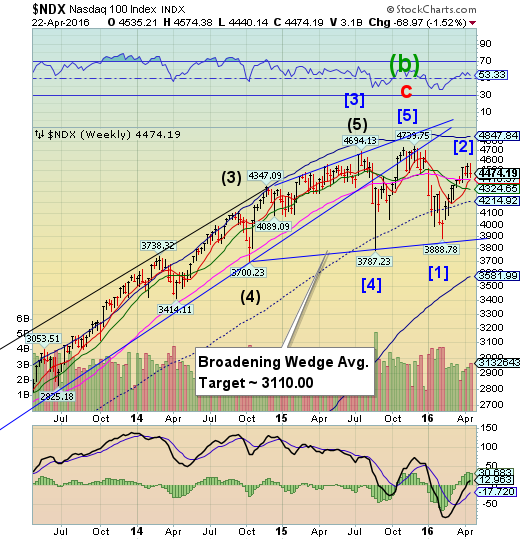
NDX probed to 4574.38 on Tuesday, but was not able to close an important gap at 4592.88 left on December 31. This is a sign of technical weakness in the NDX. Weekly Long-term support is at 4421.64. Should it decline beneath that level, NDX maybe on a sell signal.
(Reuters) Wall Street was mixed on Friday as disappointing quarterly reports from Microsoft and Alphabet slammed tech stocks and weighed against a surge in oil prices that lifted energy shares.
The S&P technology sector dropped 2.3 percent, on track for its worst daily decline since early February, with Facebook (NASDAQ:FB) down 2.9 percent and Apple (NASDAQ:AAPL) falling 1.1 percent.
Microsoft dropped 6.8 percent, contributing the biggest drag to the S&P 500, and Google (NASDAQ:GOOGL)'s parent Alphabet lost 5.6 percent as investors punished both companies for missing profit and revenue estimates.
High Yield Bond Index peaked on Wednesday.
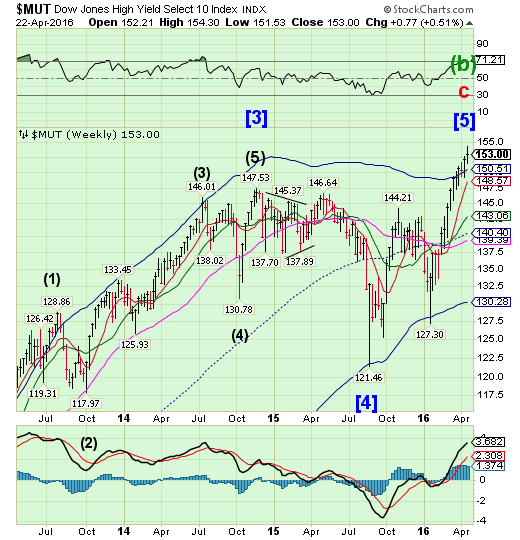
The High Yield Index peaked at 154.30 on Wednesday, 91 days from its January 20 low. This may be the most spectacular rally in High Yield bonds on record. But the rally is also being met with surging issuance of new debt to match the demand.
(MarketRealist) High-yield bond issuance activity slowed down last week after recording the highest YTD (year-to-date) volume in the previous week. According to data from S&P Capital IQ/LCD, dollar-denominated high-yield debt amounting to $4.6 billion was issued in the week ending April 15. In the previous week, high-yield issuance stood at $10.9 billion—the highest YTD issuance. The number of transactions fell to seven last week from eight in the previous week.
Last week brought the total US dollar-denominated issuance of high-yield debt to $52.0 billion in 2016 YTD. This is 55% lower compared to the same period in 2015.
The euro pulls back to weekly Short-term support.
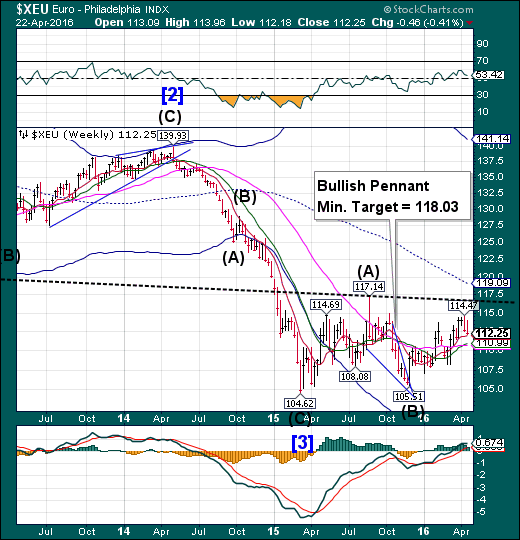
The euro has pulled back to Short-term support at 112.02. The retracement may be nearing completion early next week. Once finished, the rally may resume to the overhead trendline, or possibly higher.
(Reuters) Further price cutting failed to prevent a slowdown in euro zone business growth this month, a survey showed, likely disappointing the European Central Bank which wants inflation to rise.
The ECB's swathes of cheap loans and interest rate cuts, alongside a top-up to its monthly bond purchases, appear to have had little effect on inflation or private sector growth.
Markit's Composite Flash Purchasing Managers' Index (PMI) for the euro zone, based on surveys of thousands of companies and seen as a good guide to growth, dipped to 53.0 from March's 53.1, matching a 13-month low in February.
EuroStoxx rallies to the Broadening Wedge trendline.
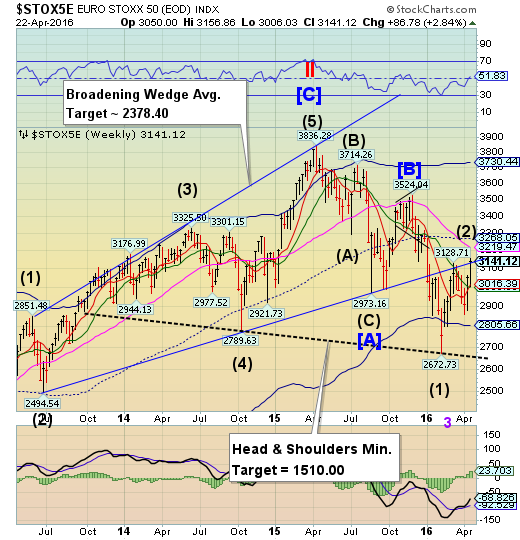
Having broken above Intermediate-term resistance, EuroStoxxrallied back to the Broadening Wedge trendline a second time. This may be considered the end of the retracement. A decline beneath weekly Short-term support at 3016.39 reinstates the sell signal.
(ZeroHedge) As a result of incorporating the Schengen Agreement (initially signed in 1985 between just five countries) into the Treaty of Amsterdam (signed in 1997, effective in 1999), Europeans and European businesses enjoy border-less travel in most countries that are part of the European Union.
Or, at least they did.
In an effort to slow Syrian, Afghan, and Iraqi migrants traveling to Europe, many countries are now implementing border controls, a decision that could prove to have significant negative consequences for Europe's economy
The yen meets its Pennant objectives, but is there more?
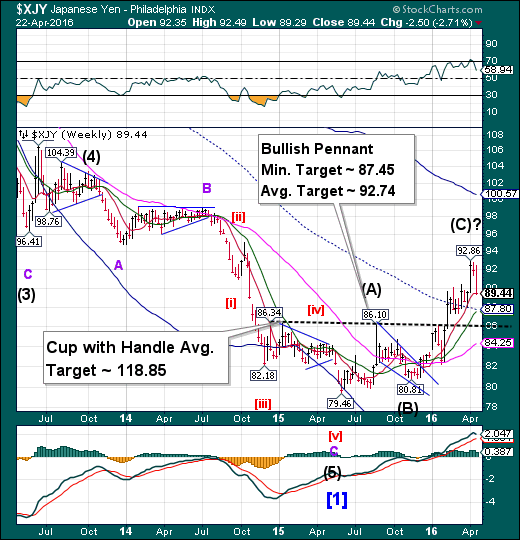
The yen has achieved its Bullish Pennant targets and begun a pullback. However, a Master cycle low is due next week that may change the outlook for the yen. Provided the pullback stops above mid-cycle support at 87.80, the inverted Cup with Handle formation may be activated.While the Cup-with-Handle target may seem farfetched, the Cycle Top at 100.57 may be attainable should the rally continue.
(WSJ) The yen fell to a three-week low against the dollar on Friday amid speculation that the Bank of Japan will introduce new stimulus at its meeting next week.
The dollar rose 2% to ¥111.635, while the euro rose 1.4% to ¥125.32.
The yen had rallied this month to its strongest point against the dollar since October 2014, driven in part by speculation that the Bank of Japan wouldn’t intervene to weaken the currency. Speculative investors pushed bullish bets on the yen to a record high in the week ended April 12, according to regulatory data.
The Nikkei challenges mid-Cycle resistance.
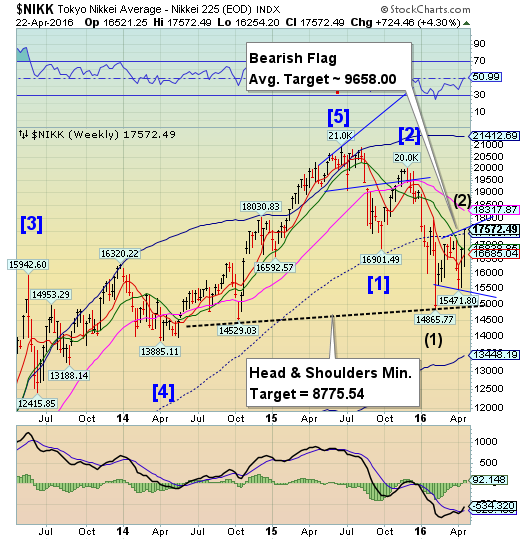
The Nikkei challenged mid-cycle resistance at 17430.44, closing above it. The rally may be complete early next week. Should that occur, the next support may be the Head & Shoulders neckline followed by the Cycle Bottom at 13448.19.
(Reuters) Japan's benchmark Nikkei index climbed to an 11-1/2 week high after the U.S. dollar rose above 110 yen for the first time since April 6, lifting a broad swath of shares that benefit from a weaker yen.
The Nikkei share average rose for a fourth straight day to end the day 1.2 percent higher at 17,572.49, its highest since February 2. Japan's benchmark index ended the week more than 4 percent higher.
A broad range of shares that included banking and securities rose sharply following a late afternoon Bloomberg report that the Bank of Japan is considering applying negative rates to its lending program for financial institutions, which helped push the yen to its lowest point since April 6.
U.S. dollar may challenge resistance before resuming its decline.
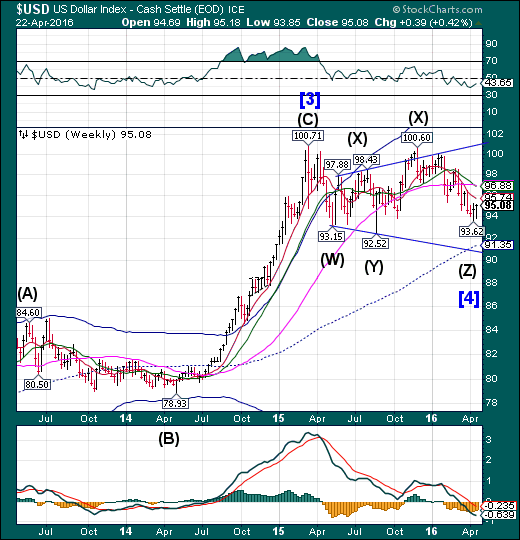
USD continues its consolidation as it prepares to challenge overhead resistance at 95.74. This may fulfill the requirements of a short-term bounce. The longer-term decline may then resume, perhaps lasting through mid-May.The ultimate target for USD may be the weekly mid-Cycle support at 91.22 or the trendline beneath it.
(ValueWalk) If one frames inflation from the standpoint of being import influenced, as a recent Bank of America Merrill Lynch (NYSE:BAC) report does, then correlated forces could come into play. If the U.S. dollar trend continues to move lower in relative value, inflation pressure could rear its head. The positive impact a higher dollar has on keeping consumer prices low could be fading into 2016 and 2017, the bank report predicts, as the low dollar trend could give central bankers what they are after: signs of economic life. Will the Fed believe it when it sees it?
USB plunges to Intermediate-term support.
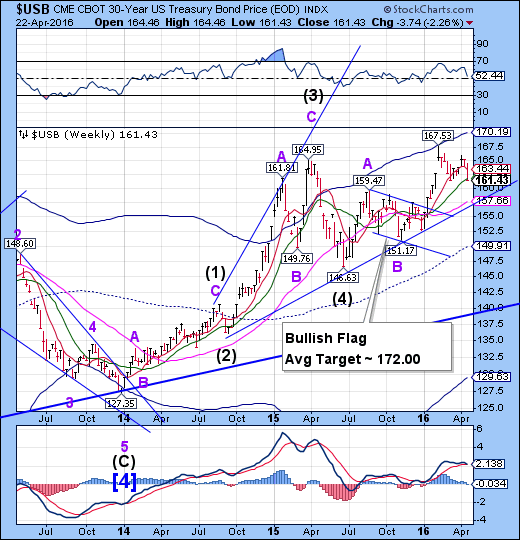
The Long Bond plunges to weekly Intermediate-term support at 161.76 to complete its pullback. USB appears to be due for its all-time high in the next three weeks. Bonds have not been this overpriced (historically lowest yields) in over 300 years.
(Bloomberg) Treasuries fell, posting their worst week since November, as a rebound in oil prices led traders to boost wagers that inflation will climb and strengthened the Federal Reserve’s case to raise interest rates this year.
The yield on 30-year U.S. bonds, the maturity most sensitive to inflation expectations, rose as crude oil gained for a fourth day. A bond-market gauge of inflation expectations had its biggest weekly advance in almost two months before the Fed’s policy committee meets April 26-27.
Gold may have begun its decline.
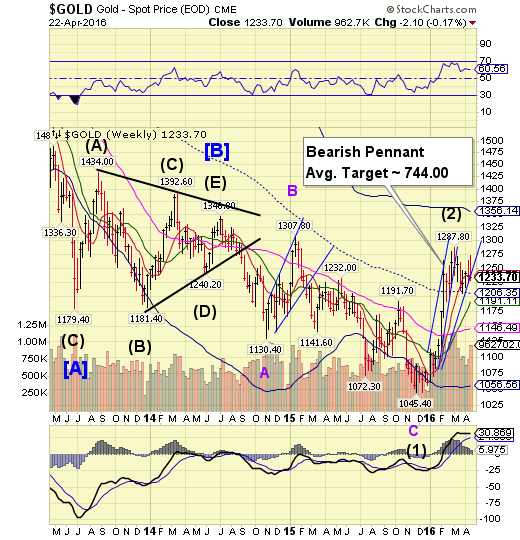
Gold made a higher retracement on Thursday, then declined to its Pennant trendline.It closed beneath its weekly Short-term support/resistance at 1237.77. Additional confirmation may come as it falls beneath the trendline, followed by mid-cycle support, at 1206.35. Investors are still treating gold as a buy-the-dip opportunity.
(MarketWatch) Precious-metals futures settled sharply lower on Friday as the U.S. dollar strengthened, pulling gold lower for the week while silver hung on to its third weekly gain in a row.
Metals traders have been contemplating the outlook for interest rates and their impact on holding nonyielding precious metals. The European Central Bank decided this week to stand pat, as expected, on its primary interest-rate tools, while monetary policy meetings for the U.S. Federal Reserve and Bank of Japan will be held next week.
Crude probed higher.
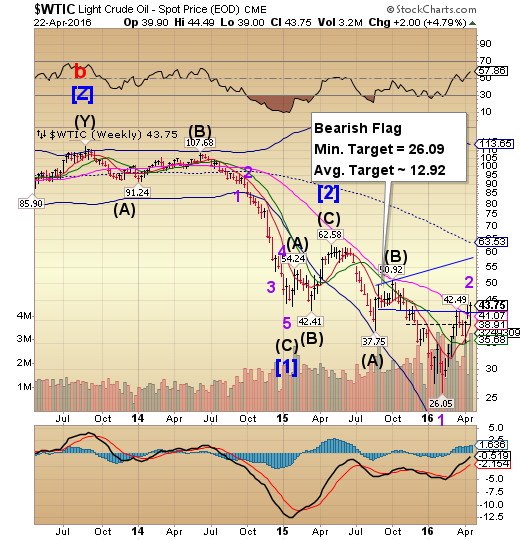
Crude made a final probe higher as a “salute” to the Liquidity Cycle that buoyed stocks and commodities for the last 69 days. A decline beneath the next level of support at 38.50 to 38.91 may trigger a multi-week decline in crude.
(Reuters) Oil prices rose on Friday and notched their third straight week of gains as market sentiment turned more upbeat amid signs a persistent global supply glut may be easing.
Strong gasoline consumption in the United States, increasing signs of declining production around the world and oilfield outages have underpinned a return to investment in the sector, traders said.
"The current rally is driven by a market sentiment that is becoming more and more convinced that the worst is over and the global oil market rebalancing process is already in play," said Dominick Chirichella, senior partner at the Energy Management Institute in New York.
Shanghai Index lost its support at the mid-Cycle line.
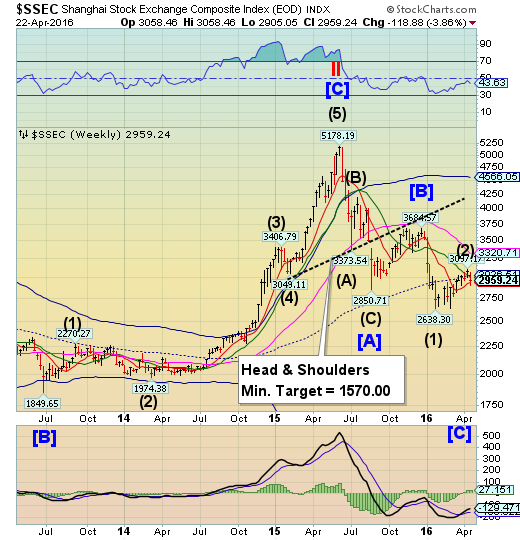
The Shanghai Index lost its weekly mid-Cycle support at 3026.51, plunging to Short-term support at 2933.29. The decline has begun. A further decline beneath Short-term support may confirm a sell signal in the Shanghai.
(ZeroHedge) After warning last year of a "practically unavoidable" hard-landing to come in China, George Soros unleashed his central-planner-crushing self last night on the great red ponzi. As we noted last night, Soros warned the "parabolic" rise in credit is very worrisome, and "eerily reminiscent of US in 2007-8," specifically adding that "most of the money that banks are supplying is needed to keep bad debts and loss-making enterprises alive." Soros' full discussion can be found below...
“Most of the damage occurred in later years," he said according to Bloomberg, referring to the spurt in US growth before the crash.
The Banking Index surges to Long-term resistance.
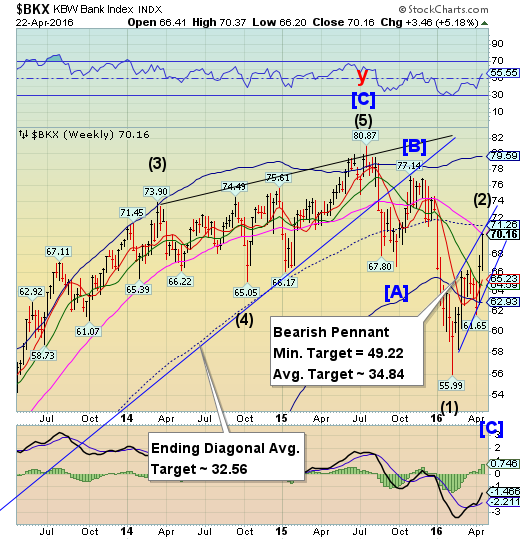
--BKX touched its Long-term resistance at 70.37 on Friday. That may be the peak in this liquidity-driven rally. The next significant low may be due by mid-May.
(Bloomberg) U.S. bank regulators are set to propose the second of two major demands on the amount of liquidity lenders need to have on hand to keep running through tough times.
The so-called net stable funding ratio, which would require banks to back away from reliance on volatile shorter-term funding, will be considered by the Federal Deposit Insurance Corp. at a meeting on April 26, the agency said Friday. The measure stems from an international accord and is intended to help prevent a repeat of the liquidity crunch seen during the 2008 financial crisis.
(ZeroHedge) As the WSJ wryly put it this morning, "Officials at the European Central Bank surely celebrated Tuesday's survey showing the last barrage of asset purchases and negative rates had a positive effect on bank lending to households and businesses."
Alas, as the WSJ also adds, "policy makers may want to hold off uncorking the champagne just yet. In fact, most banks answering the survey said the ECB's policies had no impact at all."
(ZeroHedge) Almost exactly one year ago, we wrote "Mario Draghi, Collateral Scarcity, And Why The ECB Will Soon Buy Corporate Bonds." 11 months later, the ECB confirmed this when for the first time ever, Mario Draghi said he would do purchase corporate bonds when he launched the ECB's Corporate Sector Purchase Programme (CSPP), confirming that with government bond collateral evaporating and the liquidity situation getting precariously dangerous and forcing moments of historic volatility (as in the April/May 2015 Bund fiasco), he had run out of other options.
