Selloff or Market Correction? Either Way, Here's What to Do NextSee Overvalued Stocks

10 Global Market Charts Signal End Of 7-Year Cycle Correction

Published 05/08/2016, 12:16 AM
Updated 07/09/2023, 06:31 AM
UK100
-
US500
-
FCHI
-
DJI
-
DE40
-
JP225
-
MID
-
NYA
-
RUTNU
-

Weekend Charts: SPX, NYAD, NYA, INDU, MID, RUT, FTSE, CAC, DAX, and NIKK.

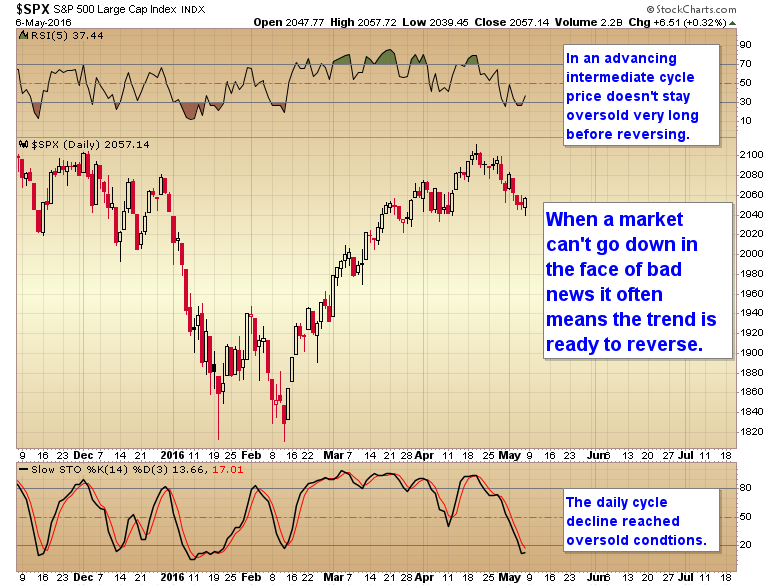
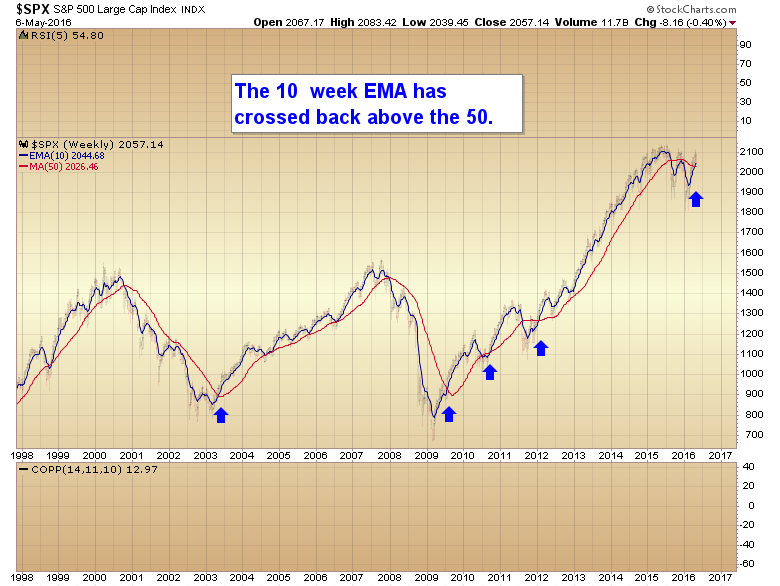
I like the odds that Friday marked the bottom of the daily cycle for the S&P 500 and half intermediate cycle decline. The next daily cycle should be right translated as well and rally at least into the second week of June before the market starts to get nervous about the Brexit and we get another corrective move.

At this point there is virtually no doubt that the 7 year cycle correction is finished and the next phase of this QE driven bull market is beginning.
SPX Daily

In an advancing intermediate cycle price doesn’t stay oversold very long before reversing. The daily cycle has reached oversold conditions.
NYAD Chart

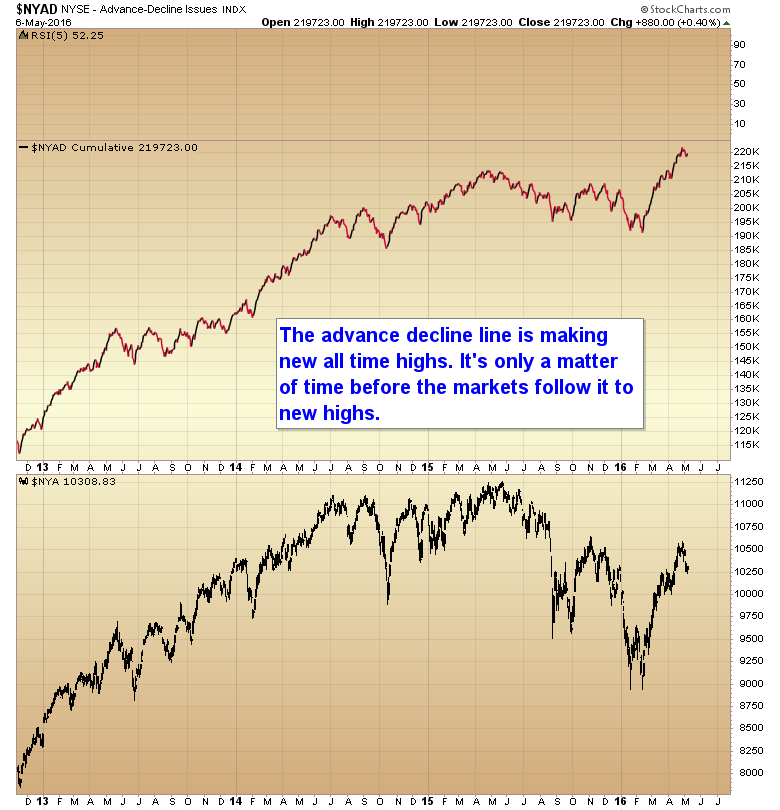
The advance-decline line is making new all time highs. It’s only a matter of time before the markets follow it to new highs.

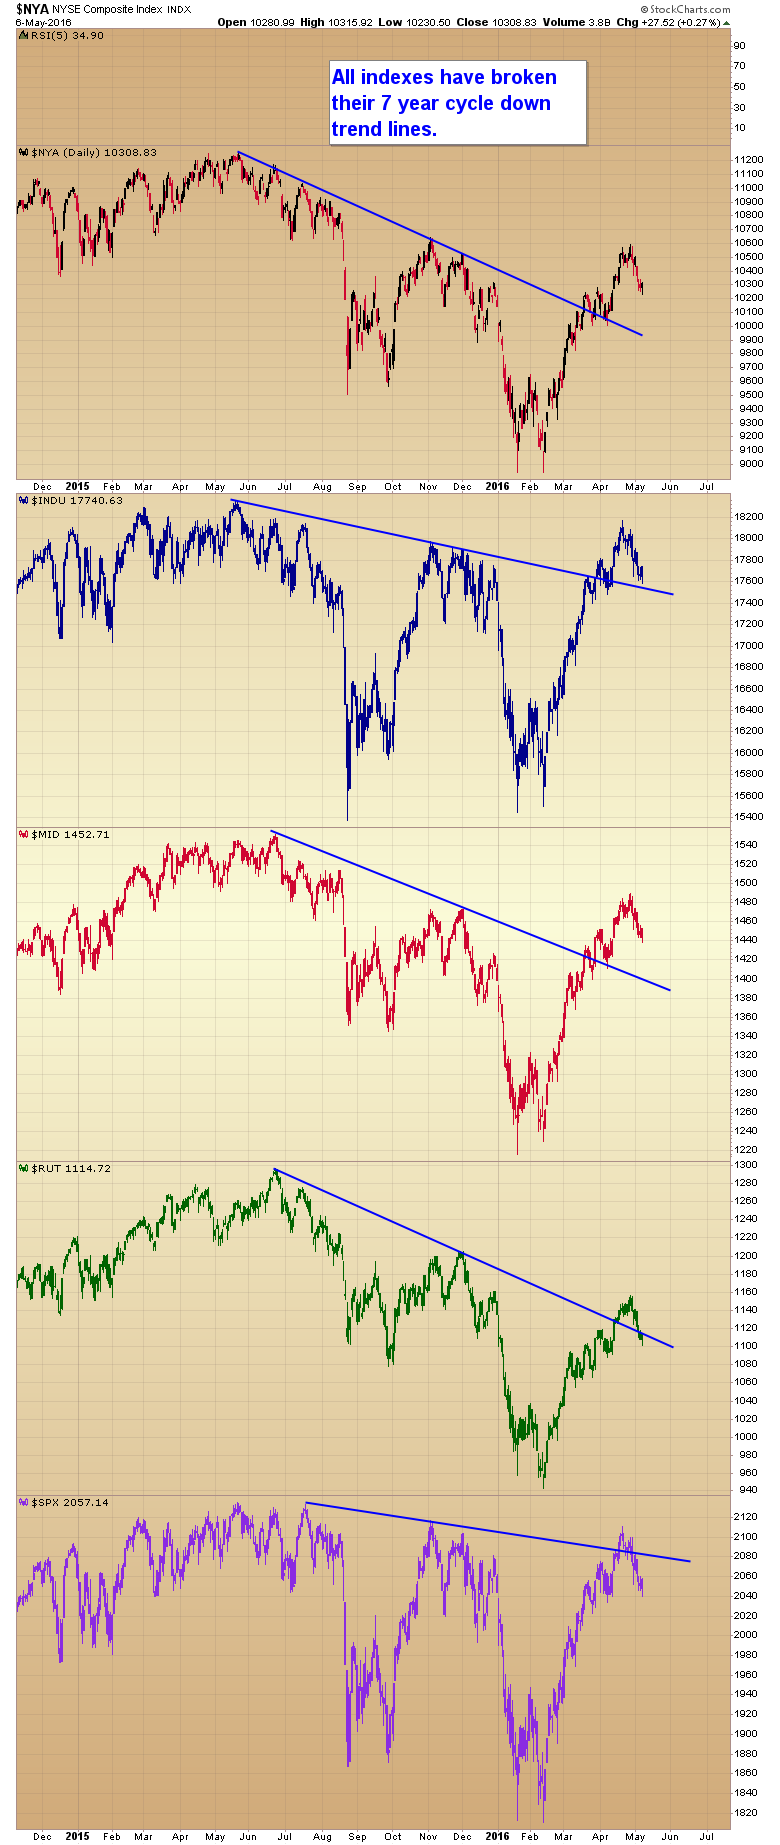
All stock market indexes have broken their 7 year cycle down trend lines (NYSE Composite, Dow Jones Industrial Average, S&P Midcap 400, Russell 2000, and SPX).
Daily NYA:INDU:MID:RUT:SPX

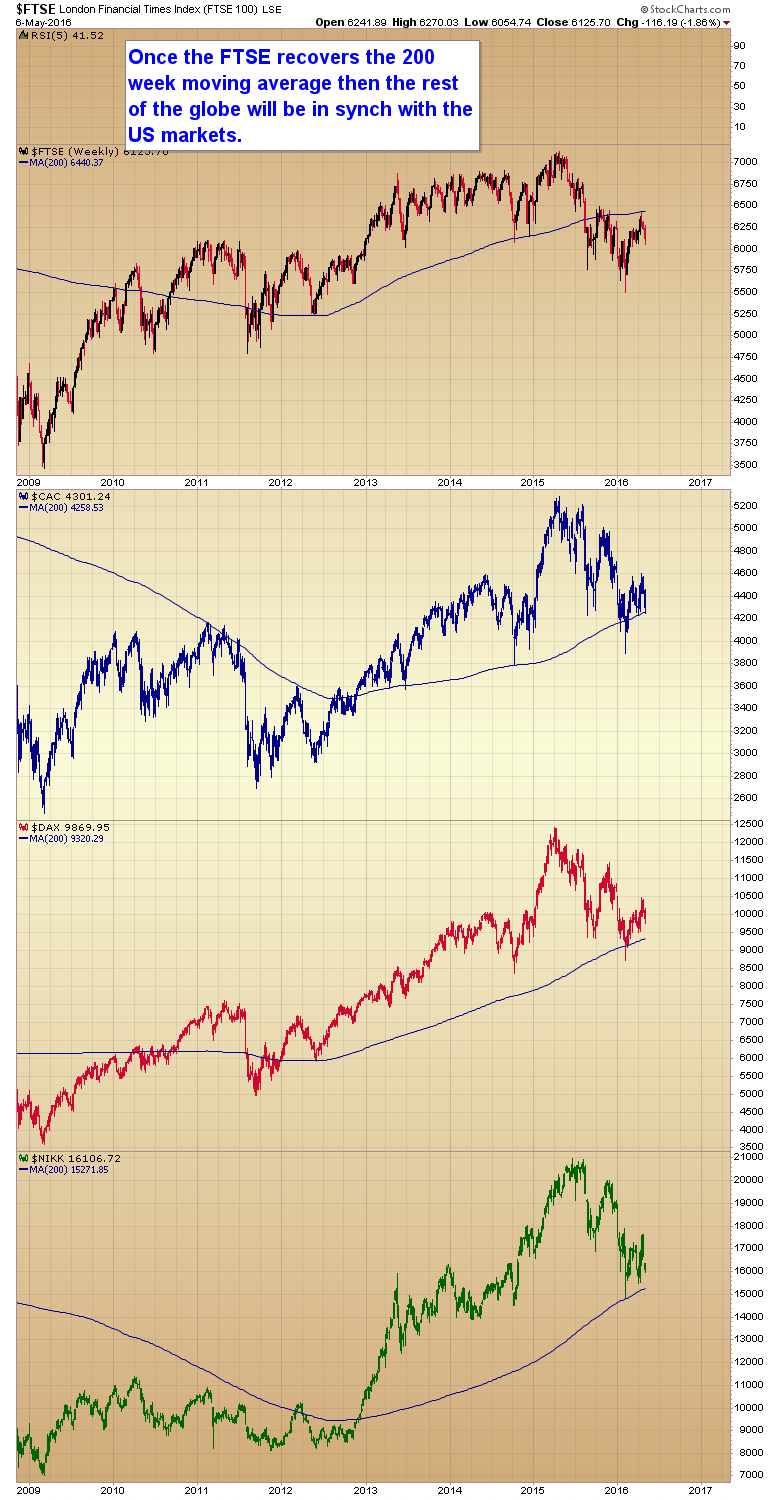
Once the FTSE 100 recovers the 200 week moving average, then the rest of the globe will be in sync with the US Markets (CAC 40, DAX, and Nikkei 225).
Weekly FTSE:CAC:DAX:NIKK

cotd5

Latest comments

Loading next article…
Risk Disclosure: Trading in financial instruments and/or cryptocurrencies involves high risks including the risk of losing some, or all, of your investment amount, and may not be suitable for all investors. Prices of cryptocurrencies are extremely volatile and may be affected by external factors such as financial, regulatory or political events. Trading on margin increases the financial risks.
Before deciding to trade in financial instrument or cryptocurrencies you should be fully informed of the risks and costs associated with trading the financial markets, carefully consider your investment objectives, level of experience, and risk appetite, and seek professional advice where needed.
Fusion Media would like to remind you that the data contained in this website is not necessarily real-time nor accurate. The data and prices on the website are not necessarily provided by any market or exchange, but may be provided by market makers, and so prices may not be accurate and may differ from the actual price at any given market, meaning prices are indicative and not appropriate for trading purposes. Fusion Media and any provider of the data contained in this website will not accept liability for any loss or damage as a result of your trading, or your reliance on the information contained within this website.
It is prohibited to use, store, reproduce, display, modify, transmit or distribute the data contained in this website without the explicit prior written permission of Fusion Media and/or the data provider. All intellectual property rights are reserved by the providers and/or the exchange providing the data contained in this website.
Fusion Media may be compensated by the advertisers that appear on the website, based on your interaction with the advertisements or advertisers.
© 2007-2024 - Fusion Media Limited. All Rights Reserved.