Trend Model signal summary
Trend Model signal: Risk-on
Trading model: Bullish
The Trend Model is an asset allocation model which applies trend following principles based on the inputs of global stock and commodity price. In essence, it seeks to answer the question, "Is the trend in the global economy expansion (bullish) or contraction (bearish)?"
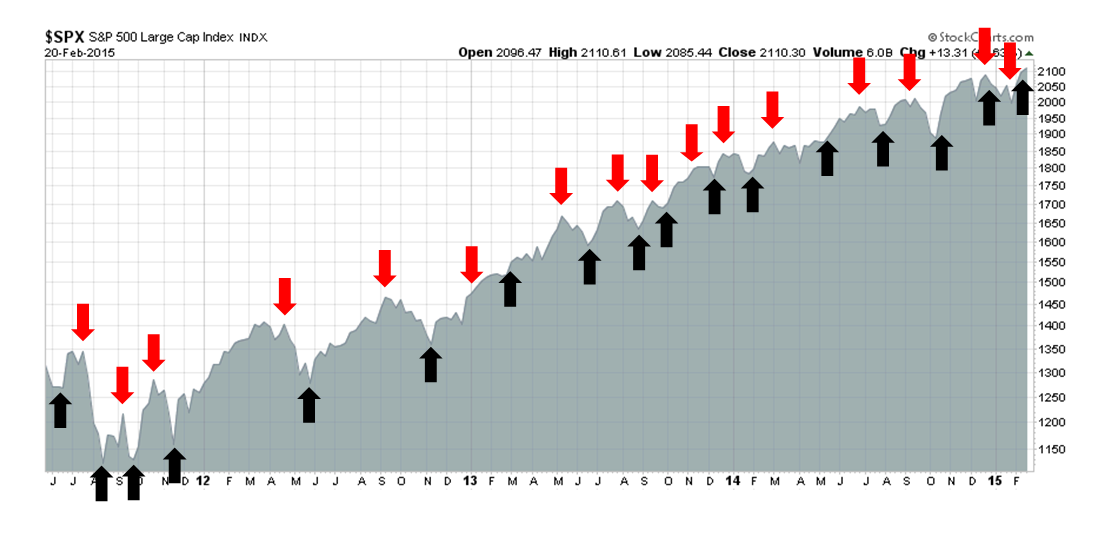
My inner trader uses the trading model component of the Trend Model seeks to answer the question, "Is the trend getting better (bullish) or worse (bearish)?" The history of actual (not backtested) signals of the trading model are shown by the arrows in the chart below. In addition, I have a trading account which uses the signals of the Trend Model. The last report card of that account can be found here.
Update schedule: I generally update Trend Model readings on weekends and tweet any changes during the week at @humblestudent.
More on 2011 = 2015
Last week, I used the 2011 stock market pattern as an analogue for the current market (see 2011 all over again?). 2011 was marked by a series of ups and downs in Europe, which resolved itself with an upside breakout sparked by initiation of the ECB's LTRO program.
I am indebted to Sassy Options who wrote a similar post entitled "Is the chop really over?" as she laid out a more detailed scenario of what might lay ahead:
After over two months of rangebound choppy action we finally made all time highs on Friday. Those that have fought the recent rally can list a plethora of reasons why the recent high is bearish; however, let there be no mistake that closing at highs is bullish as it has been in every other instance since the bull market has begun. Being bullish though doesn’t necessarily equate to higher prices next week as a consolidation period is often followed by new highs. Keeping it simple though the path of least resistance is higher and for the time being any pull-backs will probably be limited and bought back up.
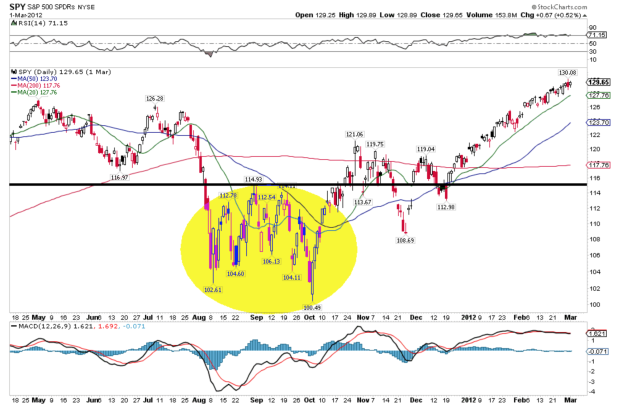
Like me, she also postulated a choppy market much like 2011 and 2012. Here is the 2011 chart that she referred to:
Here is 2012:
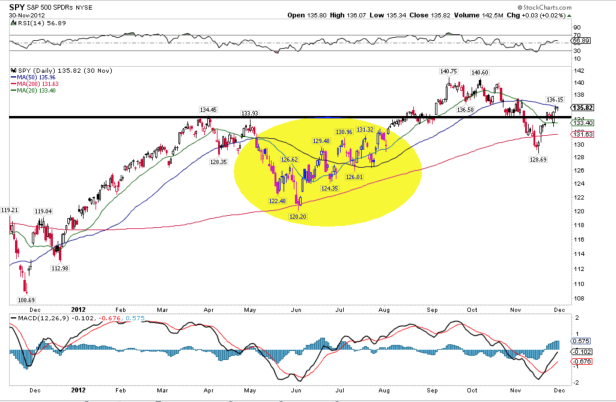
The common element found in these patterns is that, after several weeks of choppy markets, the SPX staged an upside breakout. While the market ultimately rallied after the breakout, it spent some time undergoing a sideways consolidation and possible pullback below the breakout.
The market pattern in 2015 has fit that template almost exactly. This leads me to believe that stock prices will have a bullish bias.
A trip around the world
Regular readers know that the inputs to my Trend Model are global stock and commodity prices. As we take a tour around the world, we see that pretty much all of these elements are showing signs of improvement.
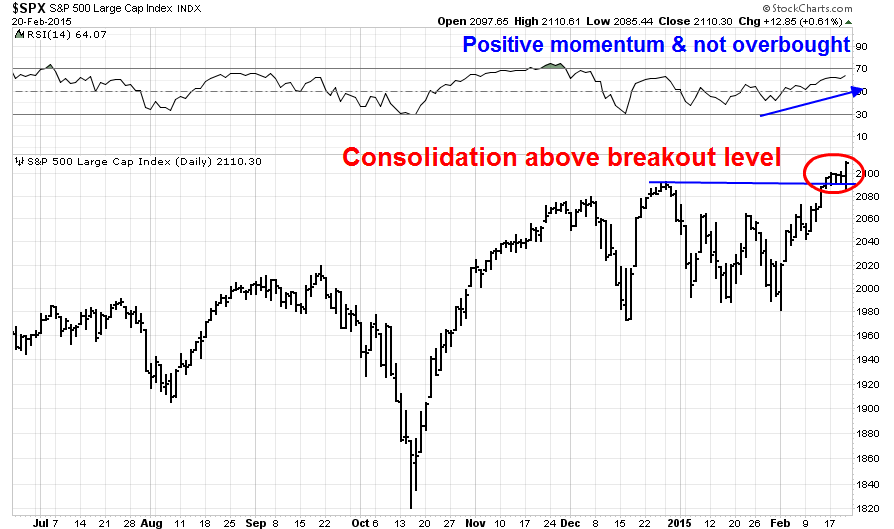
In the US, the SPX consolidated last week and then rallied on Friday to new all-time highs. Momentum continues to be positive, as measured by the 14-day RSI, which is nearing an overbought reading - but not yet.
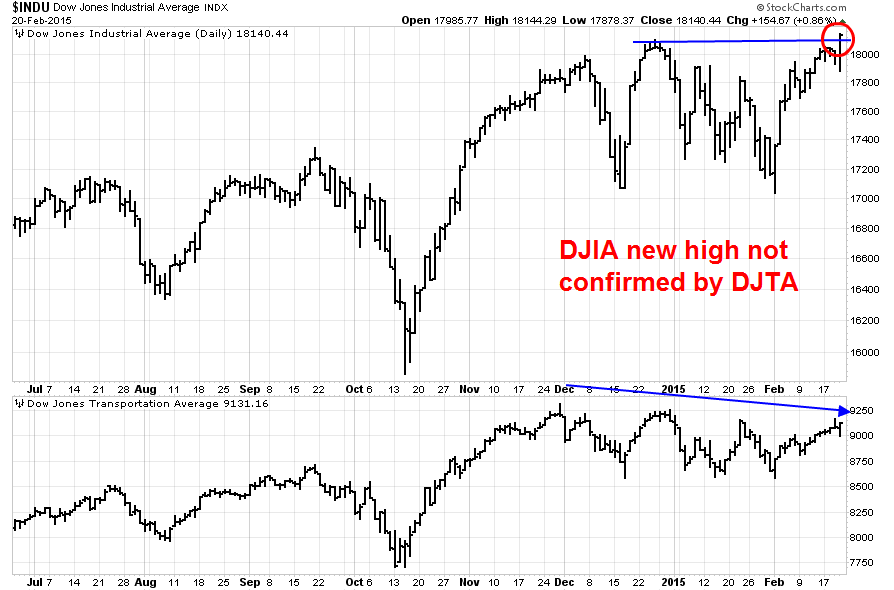
The DJIA also blasted off to a new high, though the failure of the Transports to confirm the strength of the Dow is a concern. This is something to keep an eye on given the observation from Mark Hulbert of a Dow Theory sell signal.
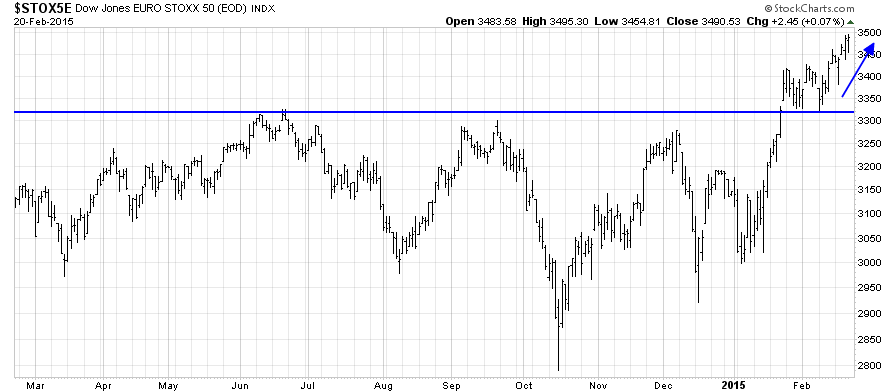
In Europe, the Euro STOXX 50 staged an upside breakout and rallied to further highs on the news of the interim deal with Greece:
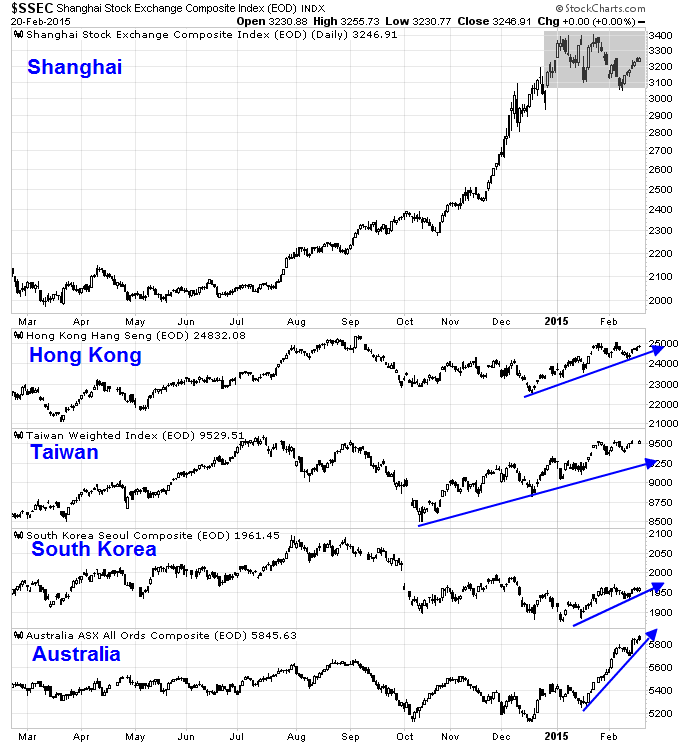
My dashboard of Greater China markets, the stock markets of China's major Asian trading partners, are also telling a bullish story. While the Shanghai Index appears to be undergoing a high level consolidation, all of the other Asian markets (Hang Seng, Taiwan, South Korea and Australia) are in uptrends.
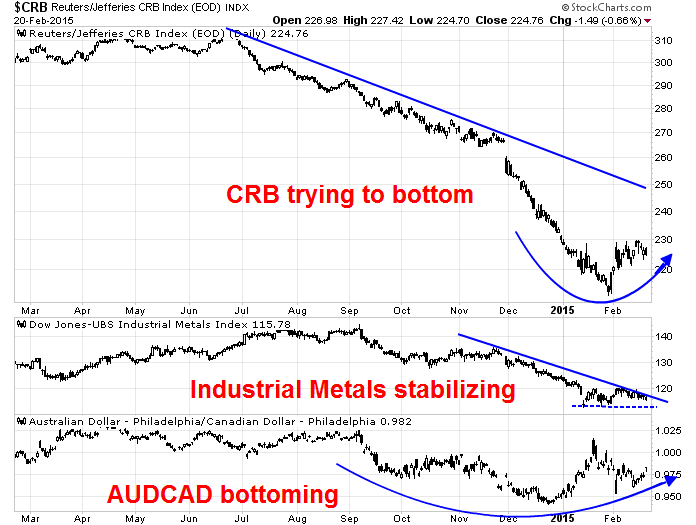
The commodity markets (via the CRB index), which are an indirect measure of global and Chinese demand, seem to be stabilizing or trying to bottom. One important metric of Chinese demand, the AUD/CAD cross rate (because resource-heavy Australia is more sensitive to China than Canada), appears to be bottoming and starting to turn up.
Immune to bad news
It seemed that the markets were becoming immune to bad news. In my last post (see Is it time to buy Greece?), which was written before the announcement of the interim deal, I became more constructive on Greek stocks and bonds because I noticed that Greek paper was not reacting to bad news. It was therefore only a matter of time before positive news appeared that would spark a turnaround rally.
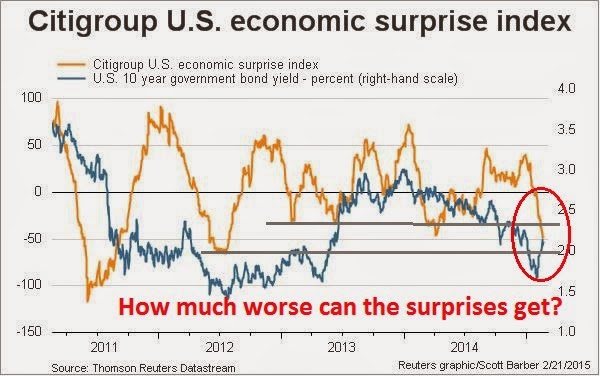
In the US, the markets were also getting immune to bad news. The high frequency macro backdrop was becoming more negative. The chart below of the Citigroup (NYSE:C) US Economic Surprise Index, which measures the rates of beats and misses of macro data, shows that the Surprise Index (orange line) has tanked to levels where it has bottomed out in the past. We only need the spark of a few positive surprises to spark a rally.
New Deal democrat, who monitors high frequency macro releases, wrote in his weekly commentary that while coincidental indicators were weak, the short and long leading indicators remained positive. His observations leads to a tentative conclusion that the current bout of macro weakness is only temporary (emphasis added):
Among long leading indicators, yields on corporate bonds and treasuries increased slightly, reflecting an abatement of immediate deflationary concerns, but they are still positive. Money supply remains quite positive. Real estate loans, and house sales as reported by DataQuick were positive. Mortgage applications were back in negative territory again this week.
The short leading indicators were mixed. Oil prices, industrial metal prices and commodities more broadly all declined slightly. Spreads between corporate bonds and treasuries also remained slightly negative. Temporary staffing and gas prices and usage remained positive, and initial jobless claims remain within a very positive range.
Coincident readings were much more negative. Consumer spending as measured by Gallup was negative yet again, although Johnson Redbook had a more positive week. Tax withholding, Rail, and Container shipping were all positive. On the other hand, Steel production and single hull shipping were negative. The TED spread backed off slightly, while LIBOR was slightly negative.
The big negative is that we are seeing YoY negative comparisons with some of the worst readings last year. Still, with the exception of commodities, generally the long and short leading indicators are positive.
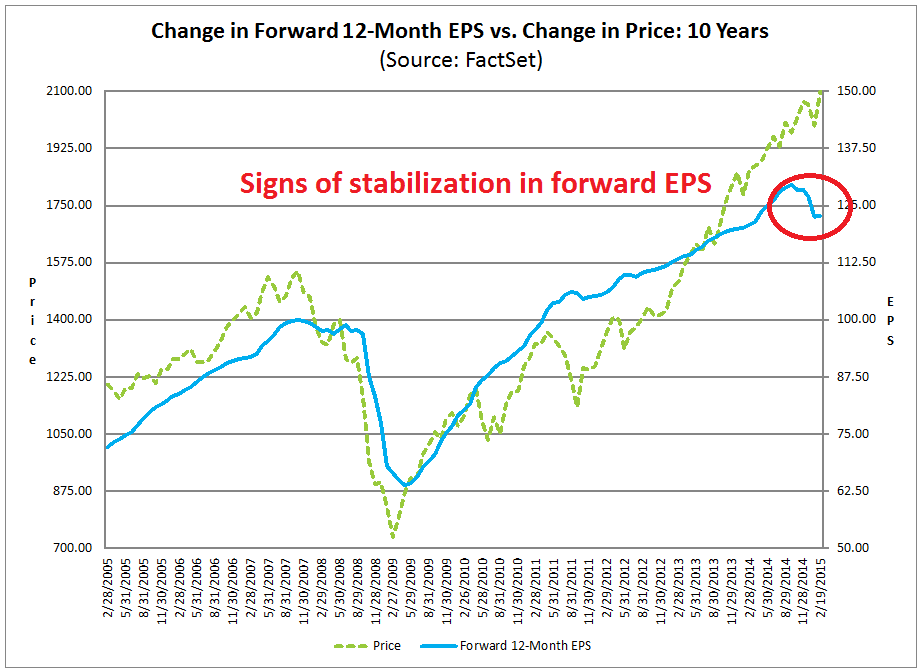
The Earnings Season report from John Butters of Factset appeared to be constructive as well. As the chart below shows, forward EPS estimates have begun to stabilize and flatten out after their big drop which began in Q4 2014.
More importantly, the earnings guidance has stabilized as well. Butters reported that 69 companies showed negative guidance, compared to 15 with positive guidance this Earnings Season. The guidance score last week was 63 negative and 11 positive. That means that, in the last week, we saw 6 companies with negative guidance and 4 with positive guidance, which is a much more balanced picture than before.
Under these circumstances, it may only take a minor positive catalyst such as the resolution of the West Coast port dispute, which Jon LaVorga at Deustche Bank projected to have shaved as much as 1% off GDP growth, to spark a market rally.
Here for a good time, not a long time
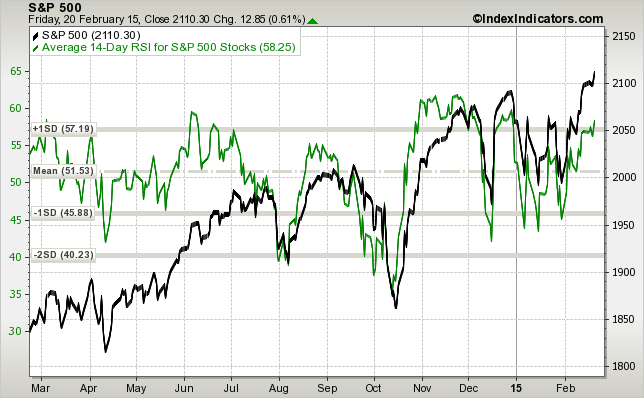
However, I would not regard the US equity outlook as one of "up, up and away!" I had outlined a number of negative breadth divergences last week and those remain a concern. Examples include this chart of the average 14-day RSI of stocks in the S&P 500 (green line) from IndexIndicators.com. Note how the green line is tracing out a pattern of lower highs as the market (black line) has rallied.
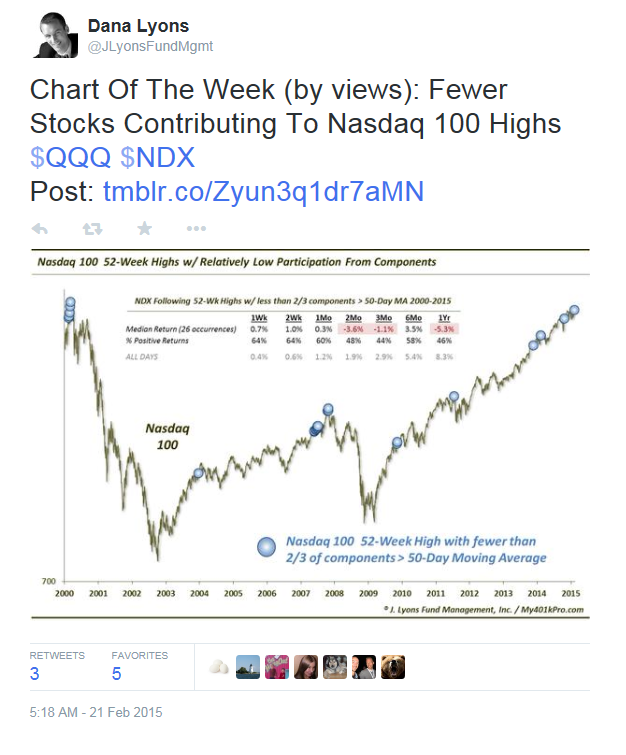
As well, Dana Lyons highlighted the fact that the NASDAQ 100 was advancing to new highs on declining breadth. Such a condition led to market weakness within a month on average.
Urban Carmel also pointed out that the CNN Money Fear and Greed Index is now at 80. Such a condition can often mean corrective action within 1-2 months of the signal.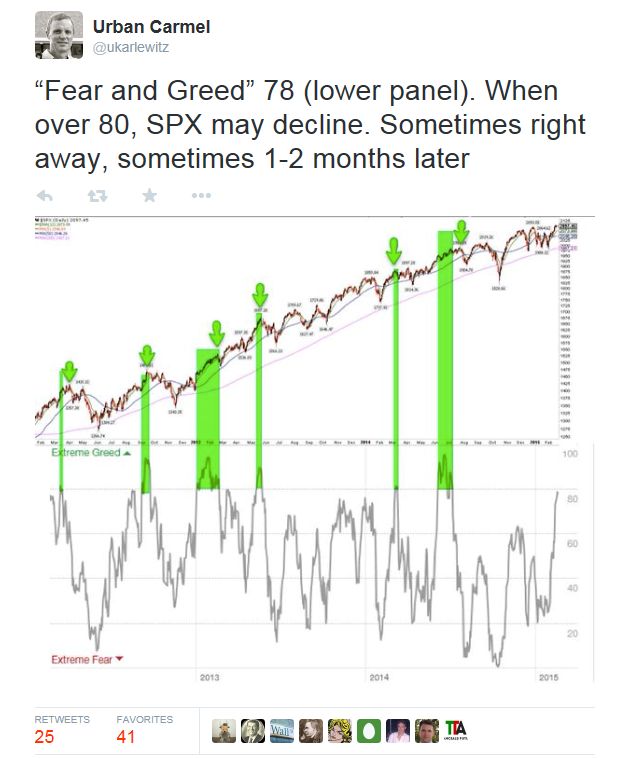
These readings suggest to me that the roadmap laid out by Sassy Options is a reasonable base case scenario. My inner trader is long and he is positioned for a stock market which may stall out in the next 1-2 weeks. One possible inflection point may be the Yellen testimony to Congress on Tuesday and Wednesday. Or it may not - that's what stop loss orders are for.
My inner investors is dipping his toe back into a higher weighting in risky assets from his neutrally weighted position between stocks and bonds.
Disclosure: Long TNA
Disclosure: Cam Hui is a portfolio manager at Qwest Investment Fund Management Ltd. ("Qwest"). This article is prepared by Mr. Hui as an outside business activity. As such, Qwest does not review or approve materials presented herein. The opinions and any recommendations expressed in this blog are those of the author and do not reflect the opinions or recommendations of Qwest.
None of the information or opinions expressed in this blog constitutes a solicitation for the purchase or sale of any security or other instrument. Nothing in this article constitutes investment advice and any recommendations that may be contained herein have not been based upon a consideration of the investment objectives, financial situation or particular needs of any specific recipient. Any purchase or sale activity in any securities or other instrument should be based upon your own analysis and conclusions. Past performance is not indicative of future results. Either Qwest or Mr. Hui may hold or control long or short positions in the securities or instruments mentioned.
Which stock should you buy in your very next trade?
With valuations skyrocketing in 2024, many investors are uneasy putting more money into stocks. Unsure where to invest next? Get access to our proven portfolios and discover high-potential opportunities.
In 2024 alone, ProPicks AI identified 2 stocks that surged over 150%, 4 additional stocks that leaped over 30%, and 3 more that climbed over 25%. That's an impressive track record.
With portfolios tailored for Dow stocks, S&P stocks, Tech stocks, and Mid Cap stocks, you can explore various wealth-building strategies.
