The news from Germany sounded dire for Greece, according to this Bloomberg report:
Germany rebuffed Greece’s request for an extension of its aid program as euro-area finance ministers prepare to meet to avert a cash crunch for the region’s most-indebted nation.
The Greek proposal “doesn’t meet the criteria agreed upon in the Eurogroup on Monday,” German Finance Ministry spokesman Martin Jaeger said in an e-mailed statement. “In truth, it aims at bridge financing without meeting the requirements” of the rescue program. European Commission Spokesman Margaritis Schinas moments earlier had said the Greek letter could be the basis for a “reasonable compromise.”
The fact that the Greek proposal for a six month extension was rejected couldn't have been a surprise. The details of the proposal were already leaked on Wednesday. The terms were the same as the one that the Eurogroup had already rejected. So the official reaction should not have been a surprise.
Bad news already priced in?
What was a surprise was the market reaction, as per Bloomberg (emphasis added) yesterday:
While the euro lost 0.1 percent, Greek bonds rose, with the yield on the 3-Year down 28 basis points at 17.09 percent at 5:33 p.m. in Athens. That compares with a record 128 percent in March 2012. Greek stocks advanced for a second day, with the Athens Stock Exchange benchmark up 1.1 percent.
An index of Greek debt known as the Bloomberg Greece Sovereign Bond Index also shows confidence remains well above the worst levels of pessimism during the past five years. The current value of 90.05 is five times the low of 17.45 June 1, 2012. The gauge peaked at 118.9 in August.
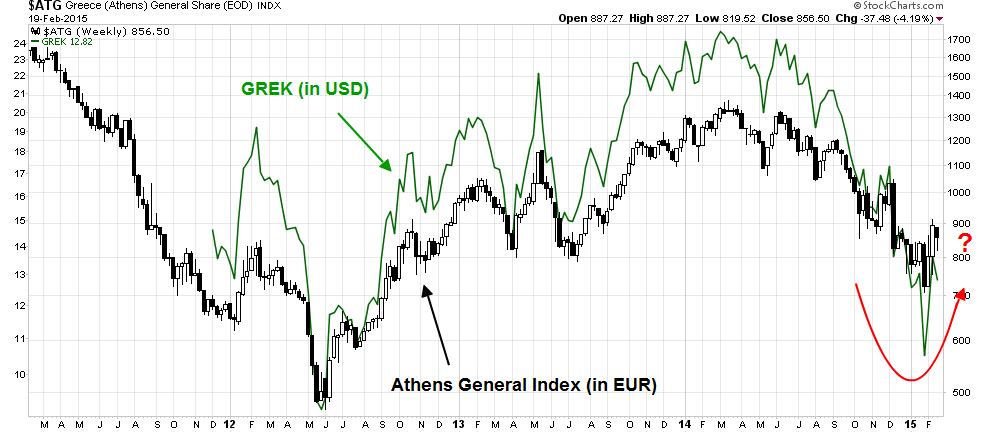
A longer term chart of the Athens General-Composite and the US Greek ETF (NYSE:GREK) also tells a similar story. Greek stocks look washed out, especially when they don't react negatively to bad news.

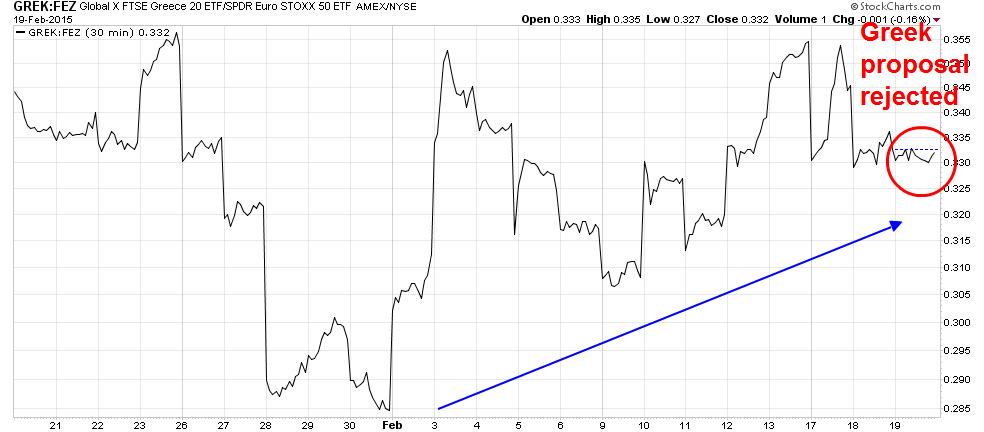
A closer look at the 30 minute tick relative performance chart of GREK compared to FEZ, the Euro STOXX 50 ETF, shows that Greek stocks have been in a relative uptrend against eurozone stocks since the end of January. When the news hit the tape of the German rejection of the latest Greek proposal, the relative performance chart barely budged.

This kind of market action yesterday tells me that unless catastrophe were to occur, such as a Greek default or Greek exit from the eurozone, pretty much all the bad news is in Greek stocks and bonds. If you want to bottom fish, you may think about buying Greek paper, either in its debt or equities, as a speculative buy at these levels.
Disclaimer: None of the information or opinions expressed in this blog constitutes a solicitation for the purchase or sale of any security or other instrument. Nothing in this article constitutes investment advice and any recommendations that may be contained herein have not been based upon a consideration of the investment objectives, financial situation or particular needs of any specific recipient. Any purchase or sale activity in any securities or other instrument should be based upon your own analysis and conclusions. Past performance is not indicative of future results. Either Qwest or Mr. Hui may hold or control long or short positions in the securities or instruments mentioned.
